Cushioned on the way down, free to run on the way up: the new S&P 500 options map after Options Expiry (OpEx)
S&P 500 after Options Expiry (OpEx): the forced selling expired Friday; EOD flows reconfigured the shelves; now the flows decide
Prefer to watch? The film version (7:43).
S&P 500 after Options Expiry (OpEx): the forced selling expired Friday; EOD flows reconfigured the shelves; now the new flows decide
The hedging changed overnight
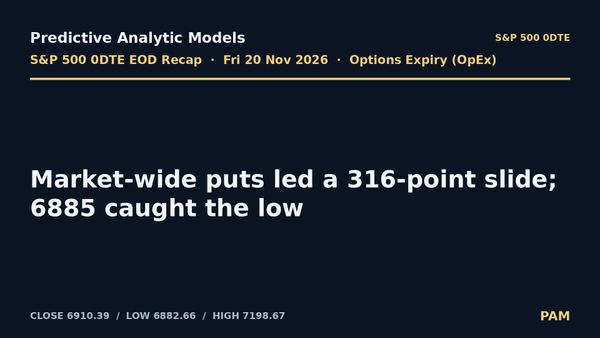
Friday was a hard day. The S&P 500 index (SPX) fell 265.44 points (−3.70%) to close at 6910.39, after trading between 7198.67 and 6882.66. The VIX closed at 35.89, up 26% on the day, after reaching 40.03 intraday. Friday was also the November monthly Options Expiry (OpEx), and that matters more for next week than the size of the drop. When the closing bell rang, a large block of options expired. The hedges dealers had been running against those options expired with them.
Everything below comes from the live options book and measured customer flows, not opinion.
What expired
At the 16:00 ET snapshot, net GEX (gamma exposure) on the expiring 20 November book was −18.79 M$ per point. The book that remains for the next three weeks, the 14 expiries from 23 November to 11 December, nets +1.41 M$ per point. That is close to neutral.
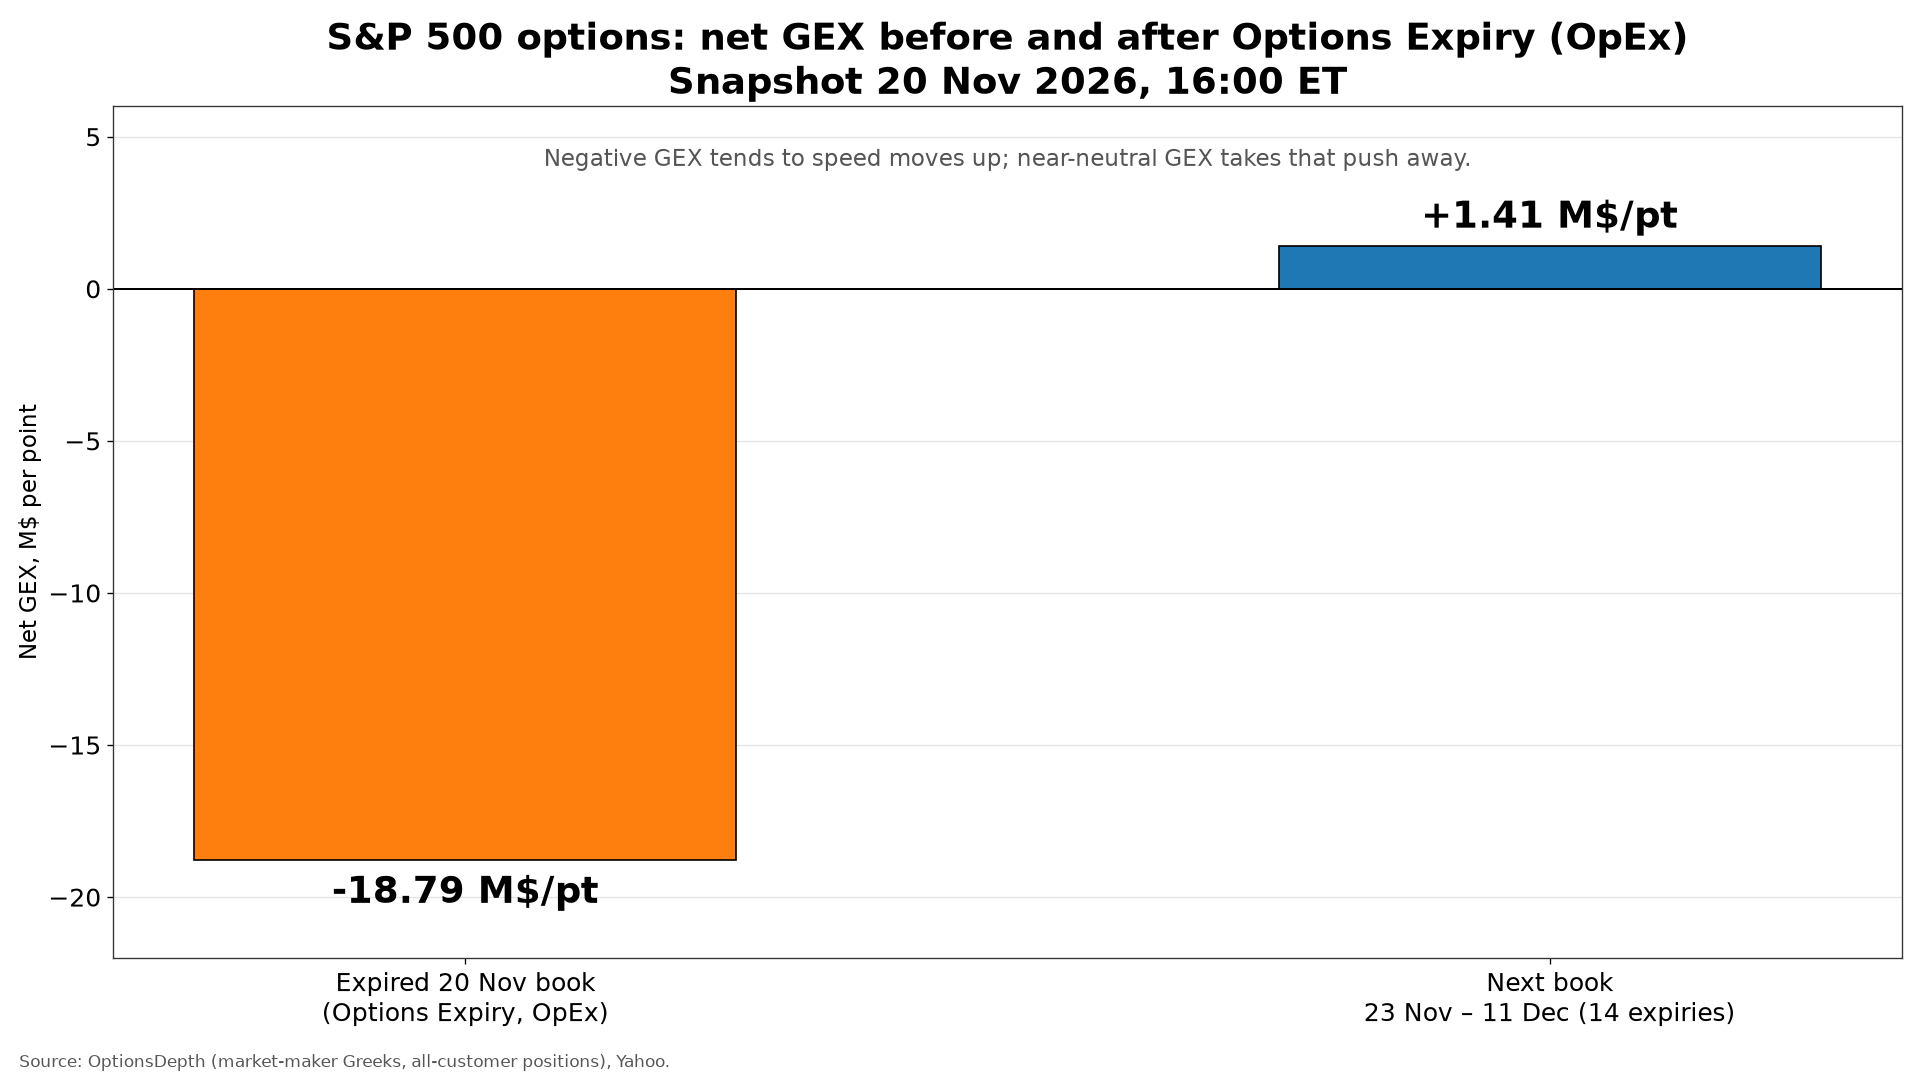
Negative GEX tends to make moves faster, because dealer hedging pushes in the same direction as price: they sell into weakness and buy into strength. A book that is close to neutral takes most of that extra push away.
Why it matters
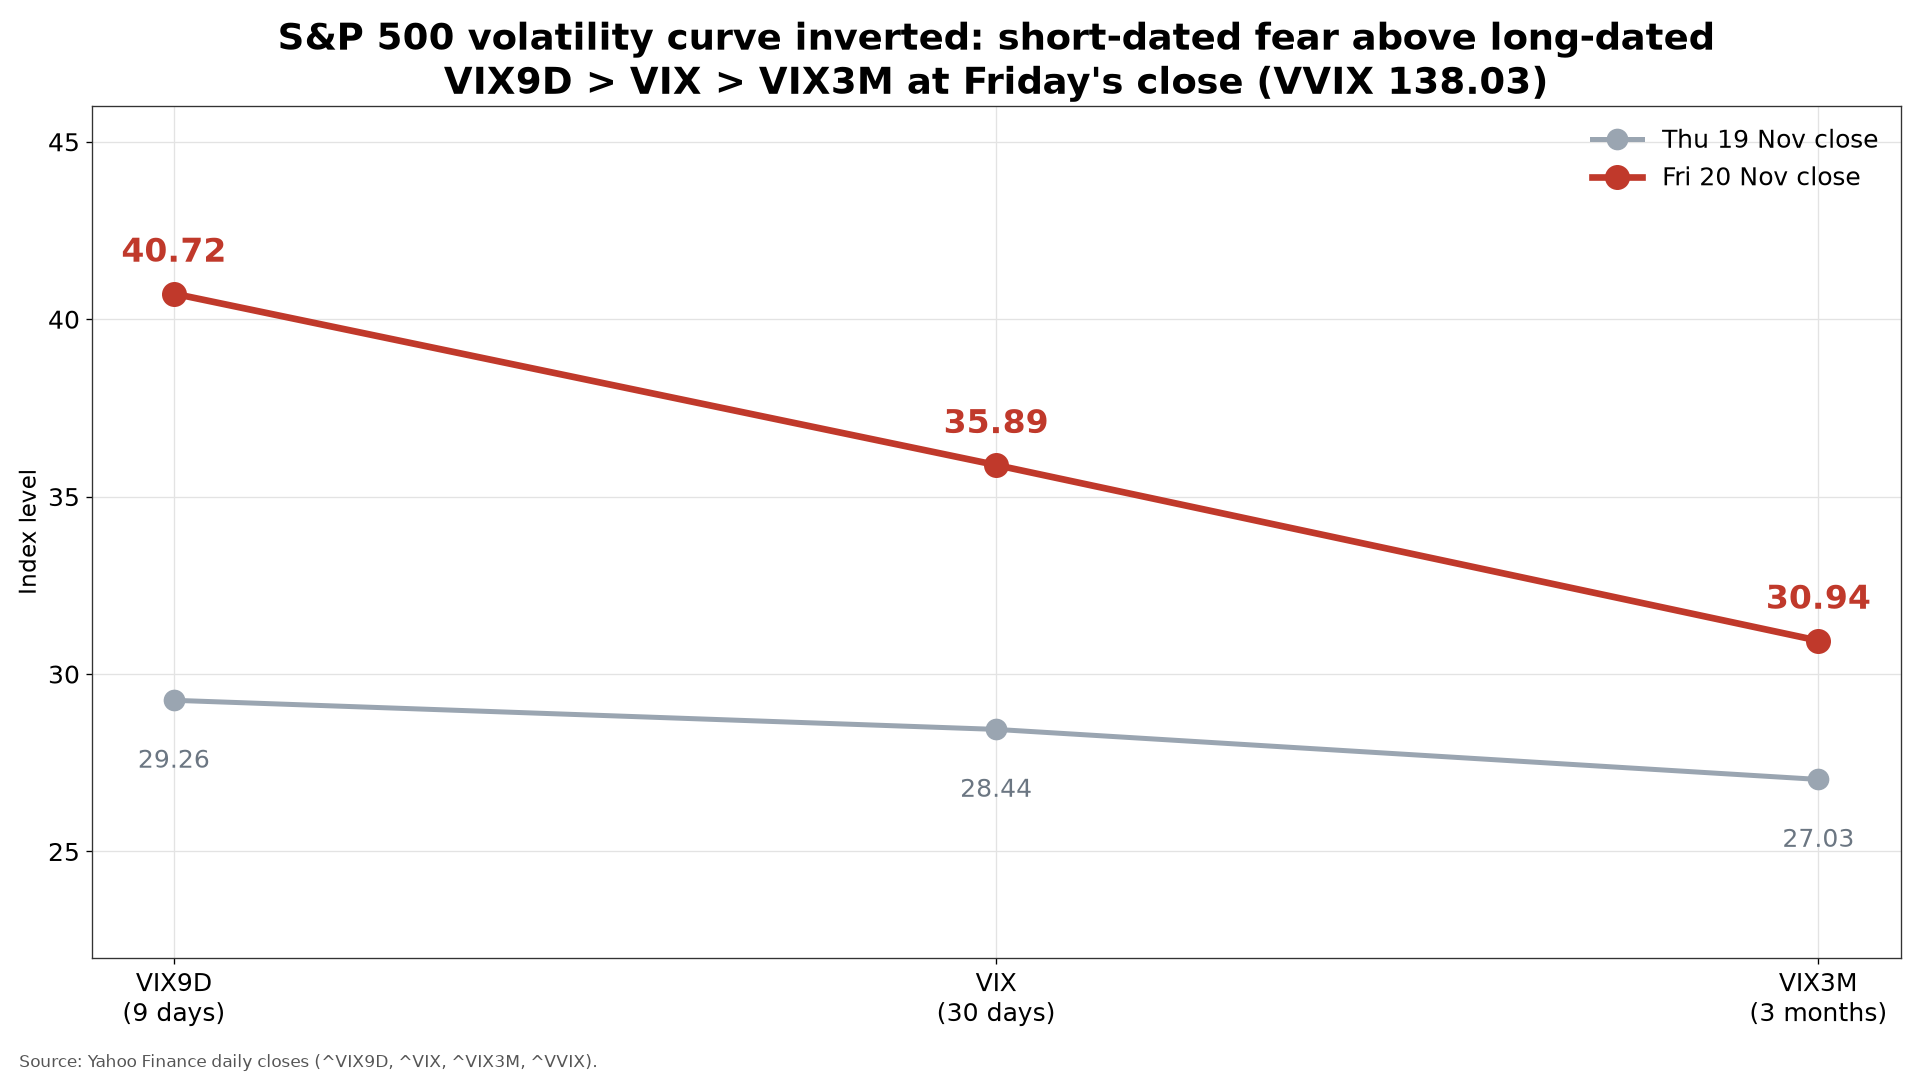
Through the slide, dealers hedged the puts they were short by selling S&P 500 futures. When those puts expire, the hedges no longer need to stay on, and buying them back is a common source of relief in the days after a monthly expiry. That tendency is usually stronger when implied volatility is stretched and inverted, as it is now. At Friday's close the 9-day VIX (VIX9D) was 40.72, above the 30-day VIX at 35.89 and the 3-month VIX (VIX3M) at 30.94. The volatility of the VIX itself (VVIX) was 138.03. When short-dated fear sits this far above longer-dated fear, the stress tends to be close to exhausted. That is a tendency, not a rule.
The new map
The Visual Queue Map stacks six views of the next book on one strike axis: customer calls, customer puts, GEX, VEX (vanna), CEX (charm) and DEX (delta). The black line marks Friday's close at 6910.39.
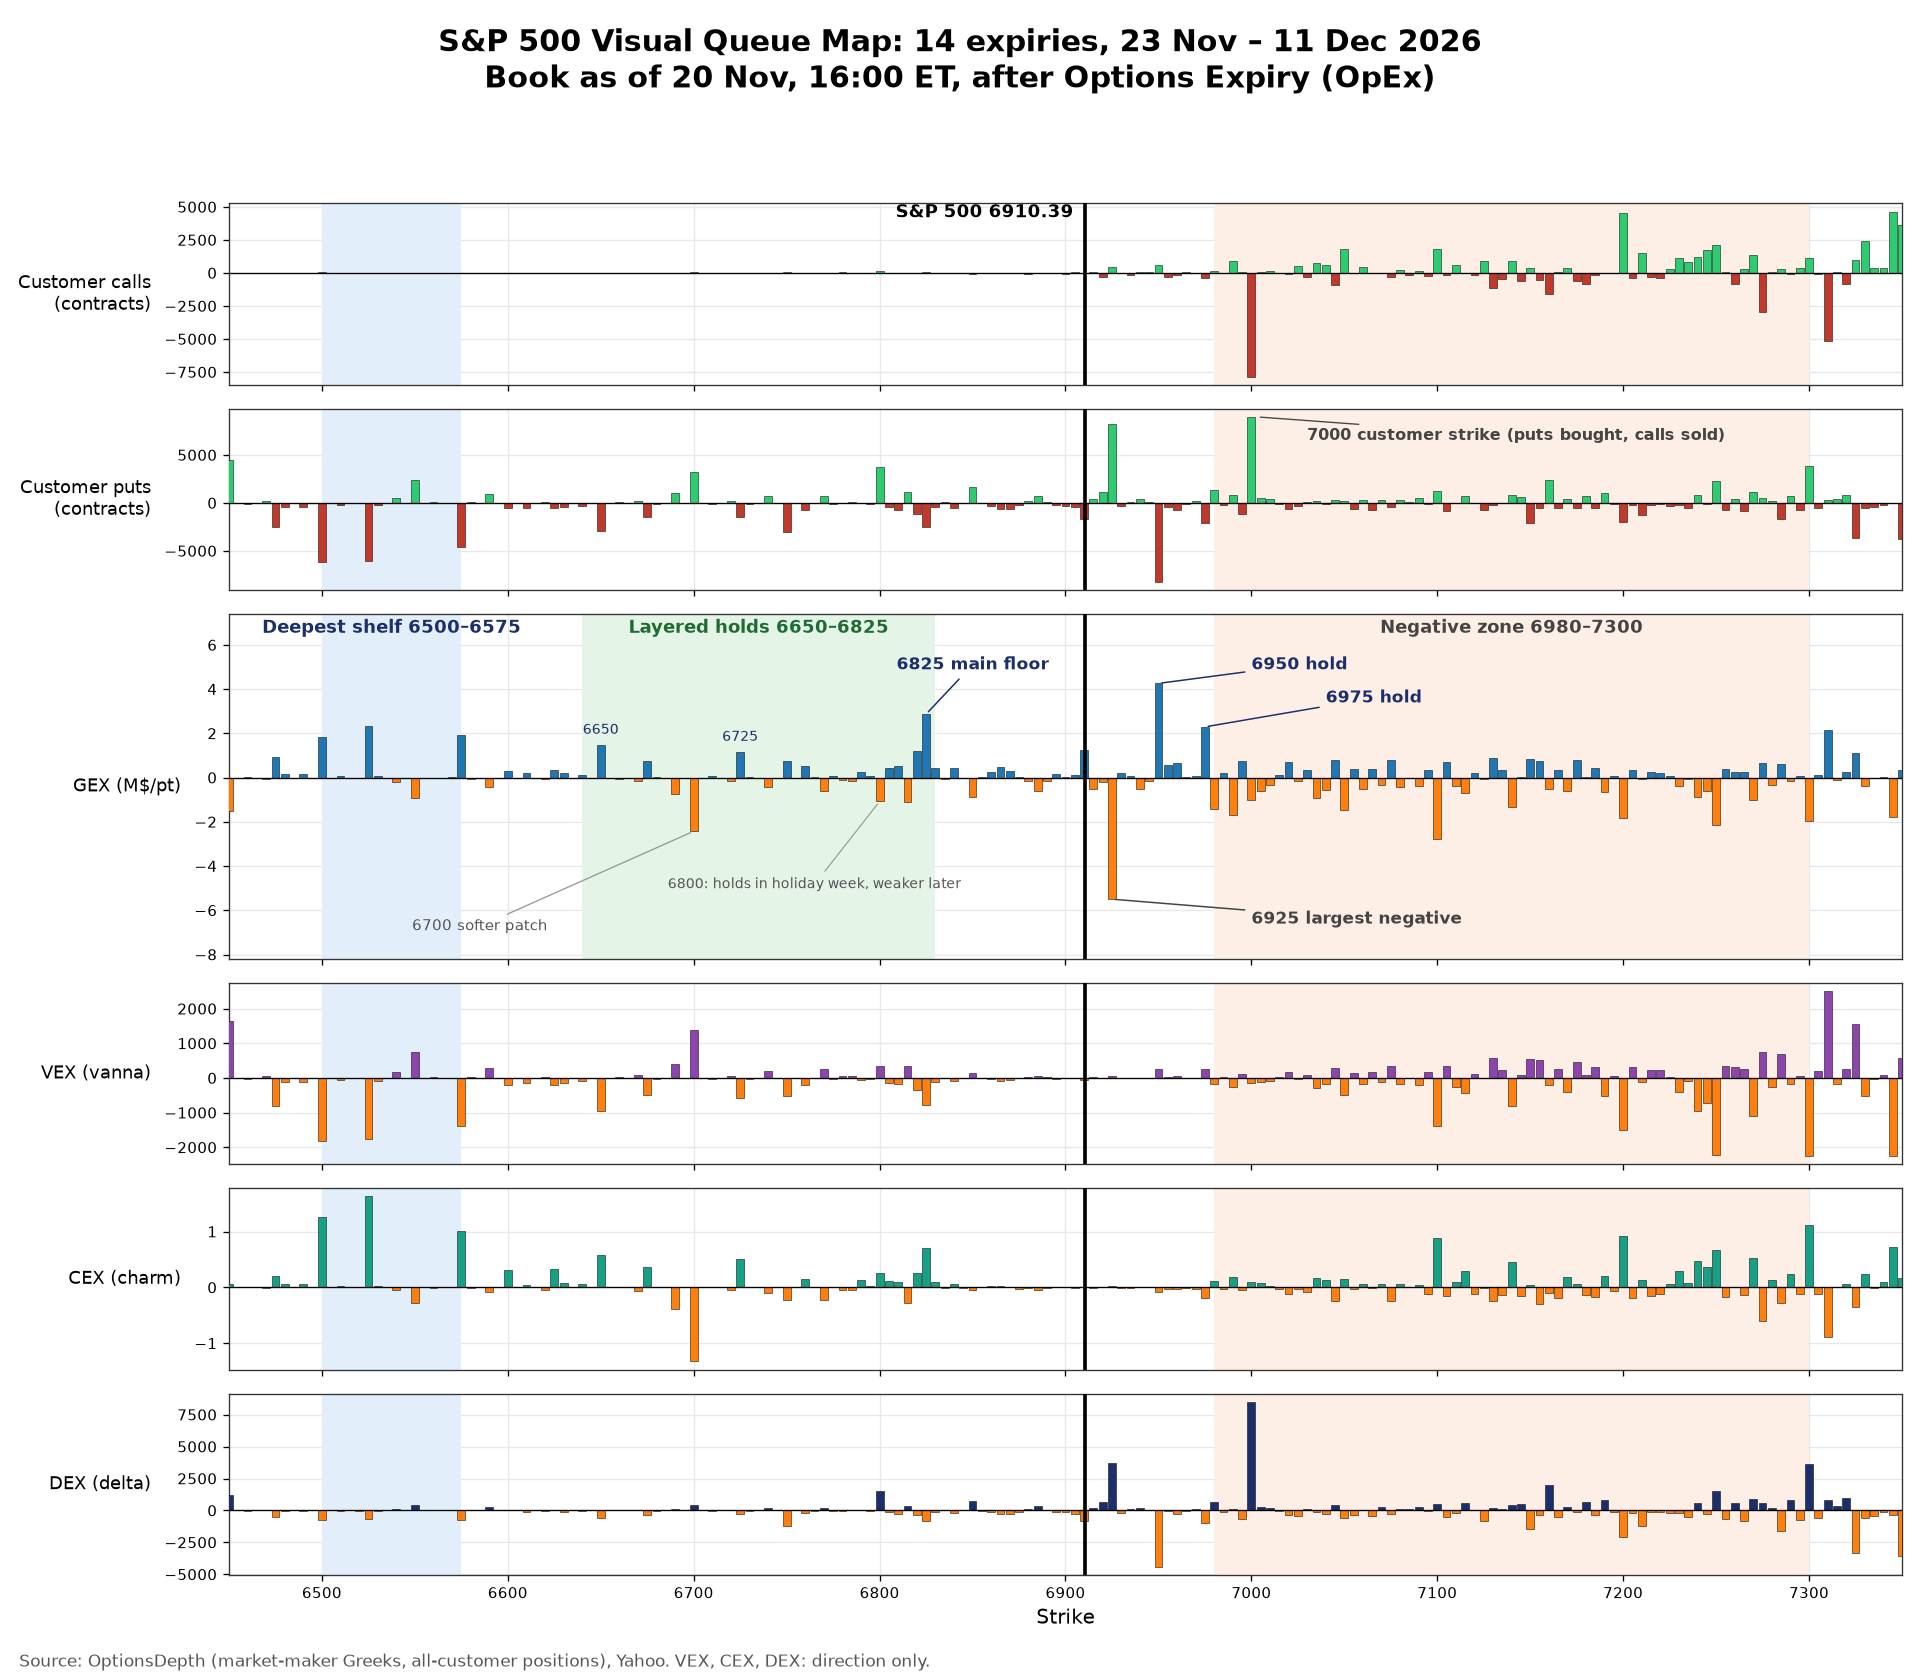
The book leans one way: positive gamma below price, negative gamma above.
- 6825 is the main floor, at +2.87 M$/pt. It is also the largest hold in Monday's own expiry. Positive GEX tends to slow price as it approaches.
- Below 6825 the support comes in layers, not a cliff: 6820 sits right under the floor, 6800 holds through the holiday-week expiries, then 6725 and 6650 before the deeper 6500–6575 shelf. The one softer patch is 6700, where a decline would tend to move faster before meeting the next hold.
- 6500 to 6575 is the deepest layer, well below the holds above it. Customers sold about 16,700 puts there, and positive gamma tends to cushion a deeper decline.
- 6925 is the largest negative strike in the window, at −5.50 M$/pt, just above price. Customers bought 8,244 puts there. Moves through 6910 to 6930 tend to be quick.
- 6950 and 6975 are holds (+4.26 and +2.30). They tend to slow a first bounce.
- 7000 is the biggest customer strike: 8,973 puts bought and 7,841 calls sold.
- From 6980 to 7300 the book is negative. A move that clears this zone tends to extend rather than grind.
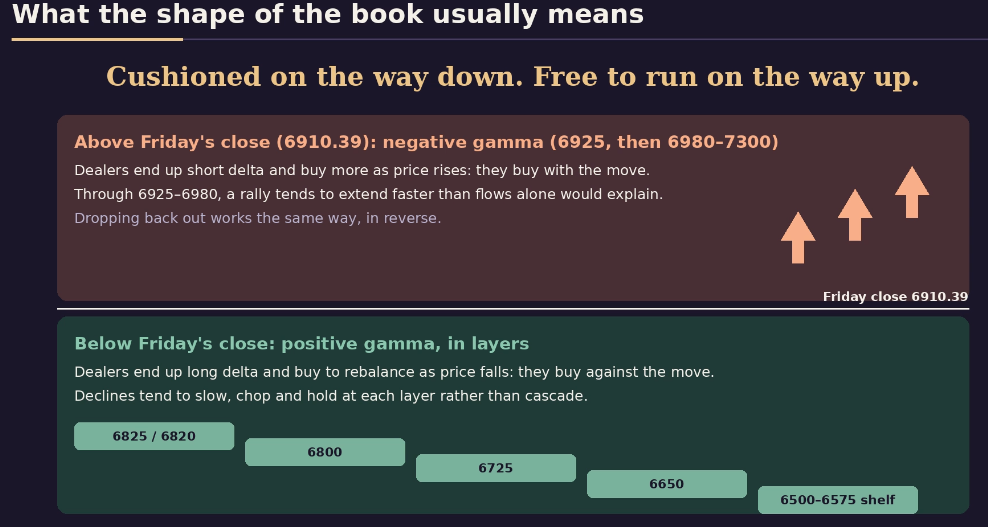
What the shape of the book usually means
- The book leans one way. Positive gamma sits below price and negative gamma sits above it. That usually means price is cushioned on the way down and free to run on the way up.
- Below price (6825 and 6820, then 6800, 6725 and 6650, then the 6500–6575 shelf). Here gamma is positive, and it comes in layers. As price falls, dealers end up long delta and buy to rebalance, so they buy against the move. Declines tend to slow, chop and hold at each layer rather than cascade.
- Above price (6925, then 6980–7300). Here gamma is negative. As price rises, dealers end up short delta and have to buy more, so they buy with the move. Once price gets through 6925–6980, a rally tends to extend faster than flows alone would explain. Dropping back out works the same way in reverse.
- What history says. It is widely documented that positive dealer gamma goes with lower realized volatility and mean reversion, and negative gamma with higher volatility and trending moves. In most sell-offs the negative gamma sits below price, which is why declines speed up. Friday's expiry removed that, and the negative side now sits overhead. That is the classic profile for a relief move once flows turn.
- The caveat. Gamma shapes a move; it does not start one. Flows still have to turn, which is the third MenthorQ condition. We have not measured a hit rate for this profile on our own books, so read it as a tendency, not a statistic.
The MenthorQ checklist
MenthorQ's 20 November case study on Nasdaq 100 futures (NQ) (link) makes a useful point. When dealers carry negative vanna, rising implied volatility pushes them to buy the underlying to stay hedged. On Friday, NQ kept falling while its implied volatility rose from 36.3% to 39.5%, because the selling outweighed that hedge buying. Then it bounced about 200 points off a 25,065 gamma level as their flow gauge turned up.
Their warning is the important part: negative vanna alone did not stop the slide. The setup worked because three things lined up.
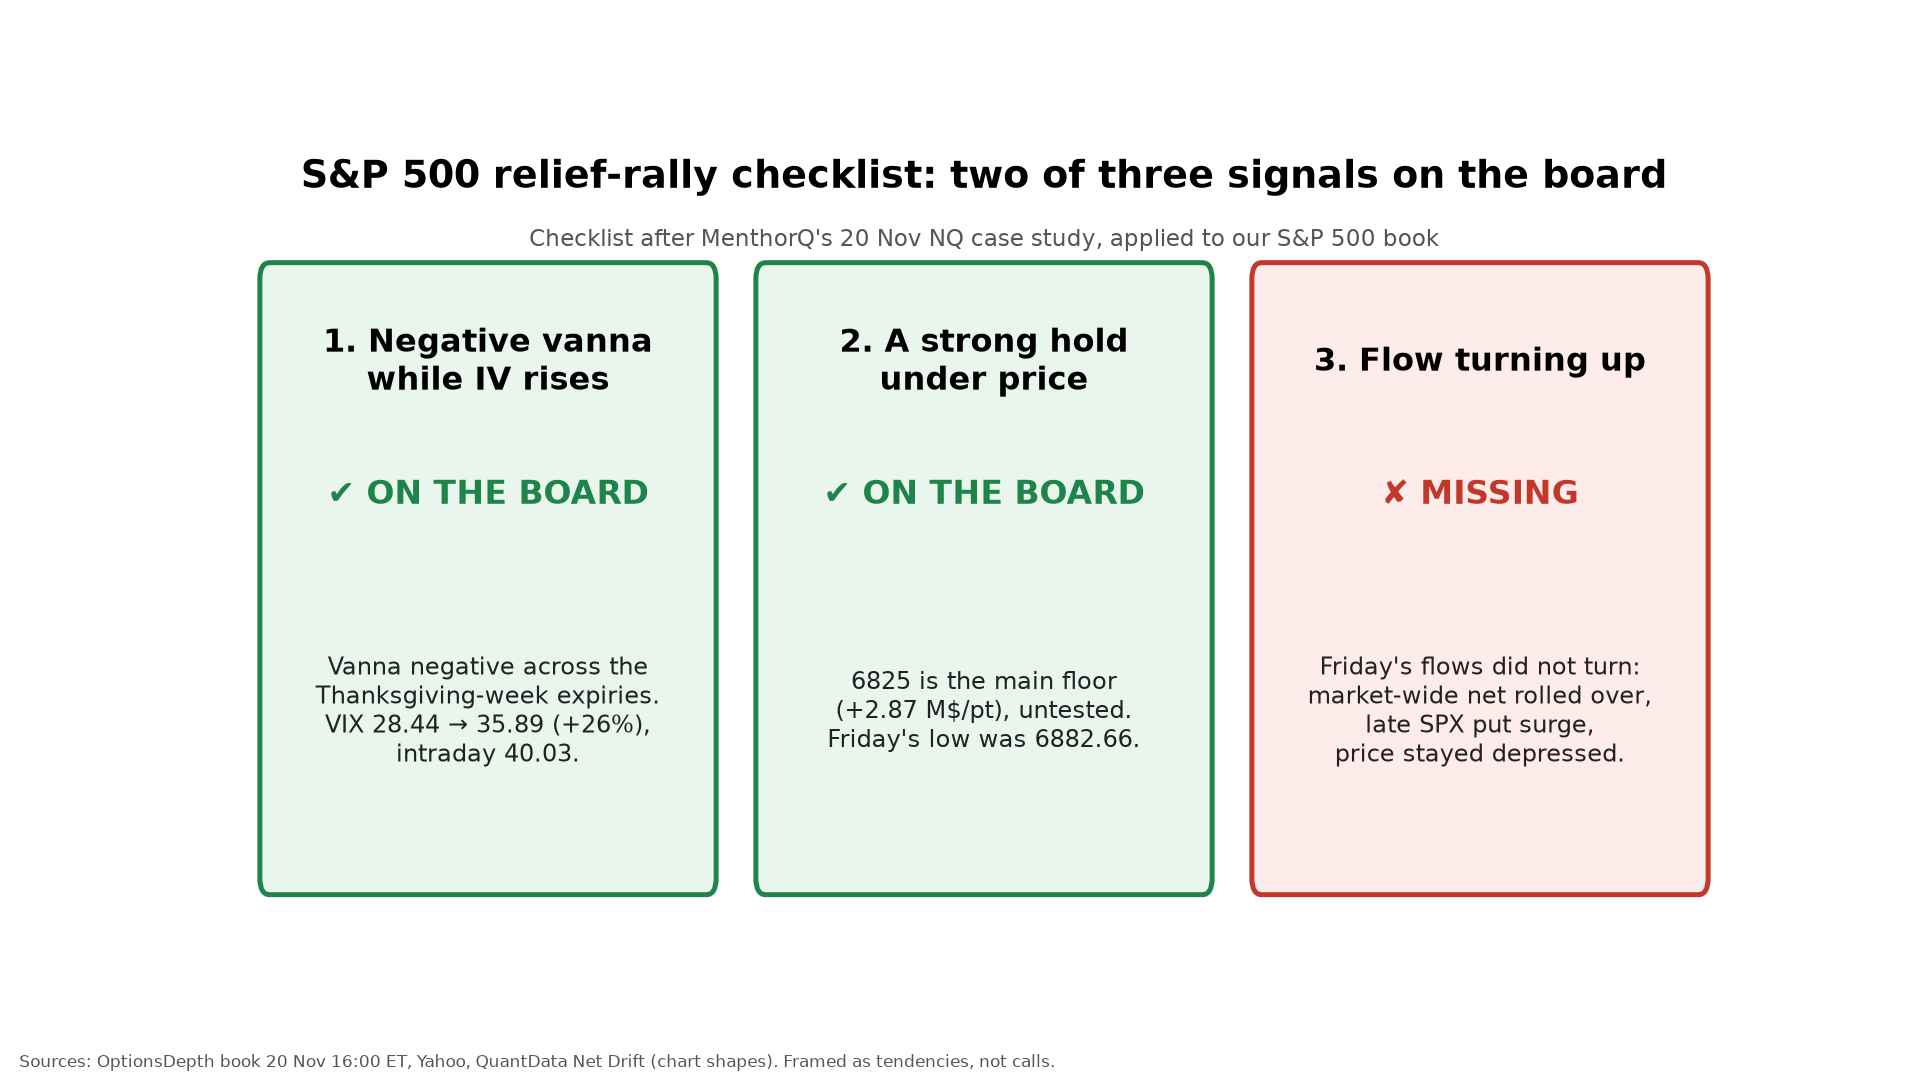
Applied to our S&P 500 book:
- Negative vanna while implied volatility rises: on the board. Vanna is negative across the Thanksgiving-week expiries, and the VIX rose 26%. Between 14:00 and 15:55 ET on Friday, the VIX climbed from 31.69 to 39.53 while the S&P 500 fell from 7021 to 6918. The NQ case looked the same. One caveat: right at 6900 to 6950, vanna is close to flat, so the effect works mainly lower down, around the holds.
- A strong hold under price: on the board. 6825 has not been tested; Friday's low was 6882.66.
- Flows turning up: missing. See the next section.
Flows so far
Market-wide net drift leads the read. Puts led from the open and kept building. Calls rallied hard after midday and pulled the net line back near flat, then it rolled over into the close, ending at about −$162M. Friday's customer flow was identical under a 90-day and a 30-day expiry filter (market-wide calls +$192.76M, puts +$354.99M, net −$162.23M; SPX calls +$84.15M, puts +$183.46M, net −$99.30M), so all of it sat in contracts expiring within 30 days, the same window as the post-expiry book.
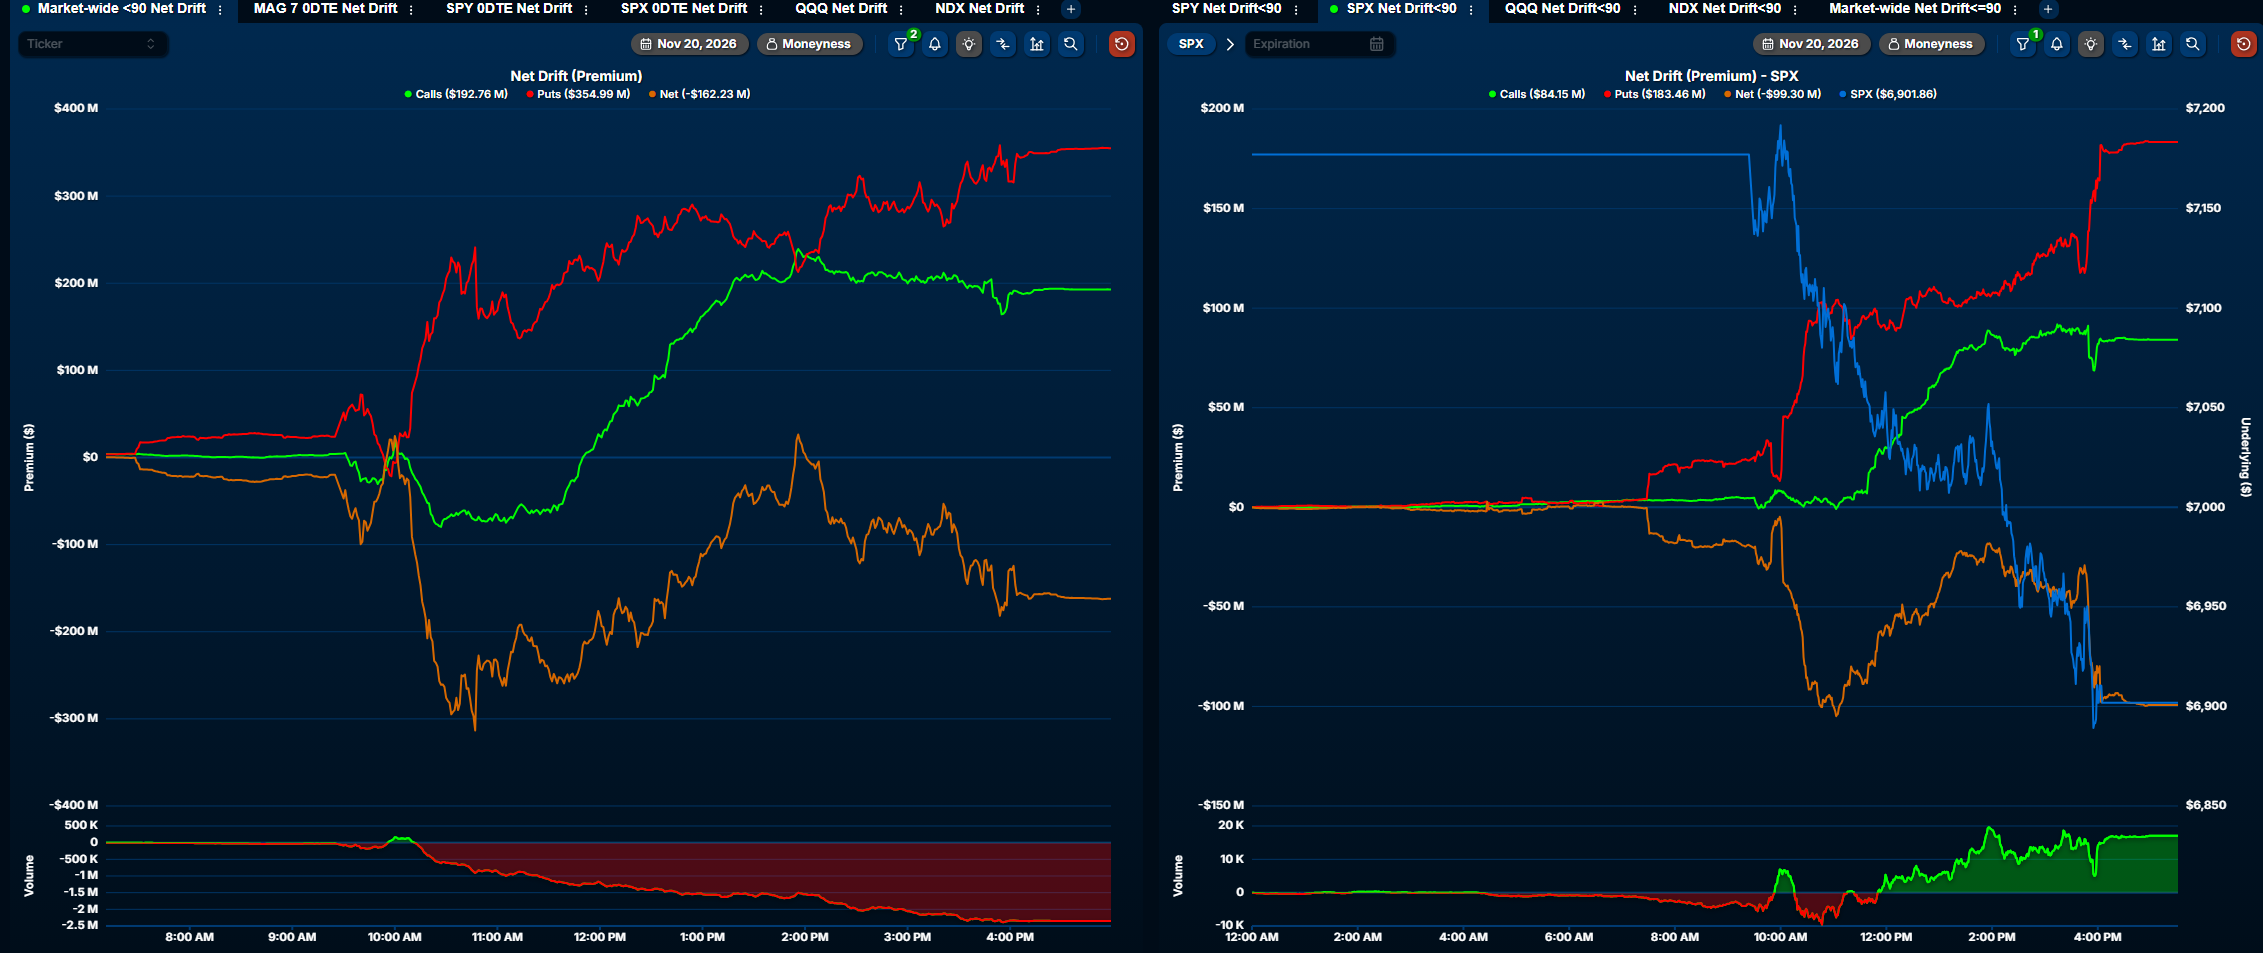
In SPX options, calls climbed after noon and net flow recovered off its lows. Then a late surge in put buying capped the recovery, and price stayed depressed into the close.
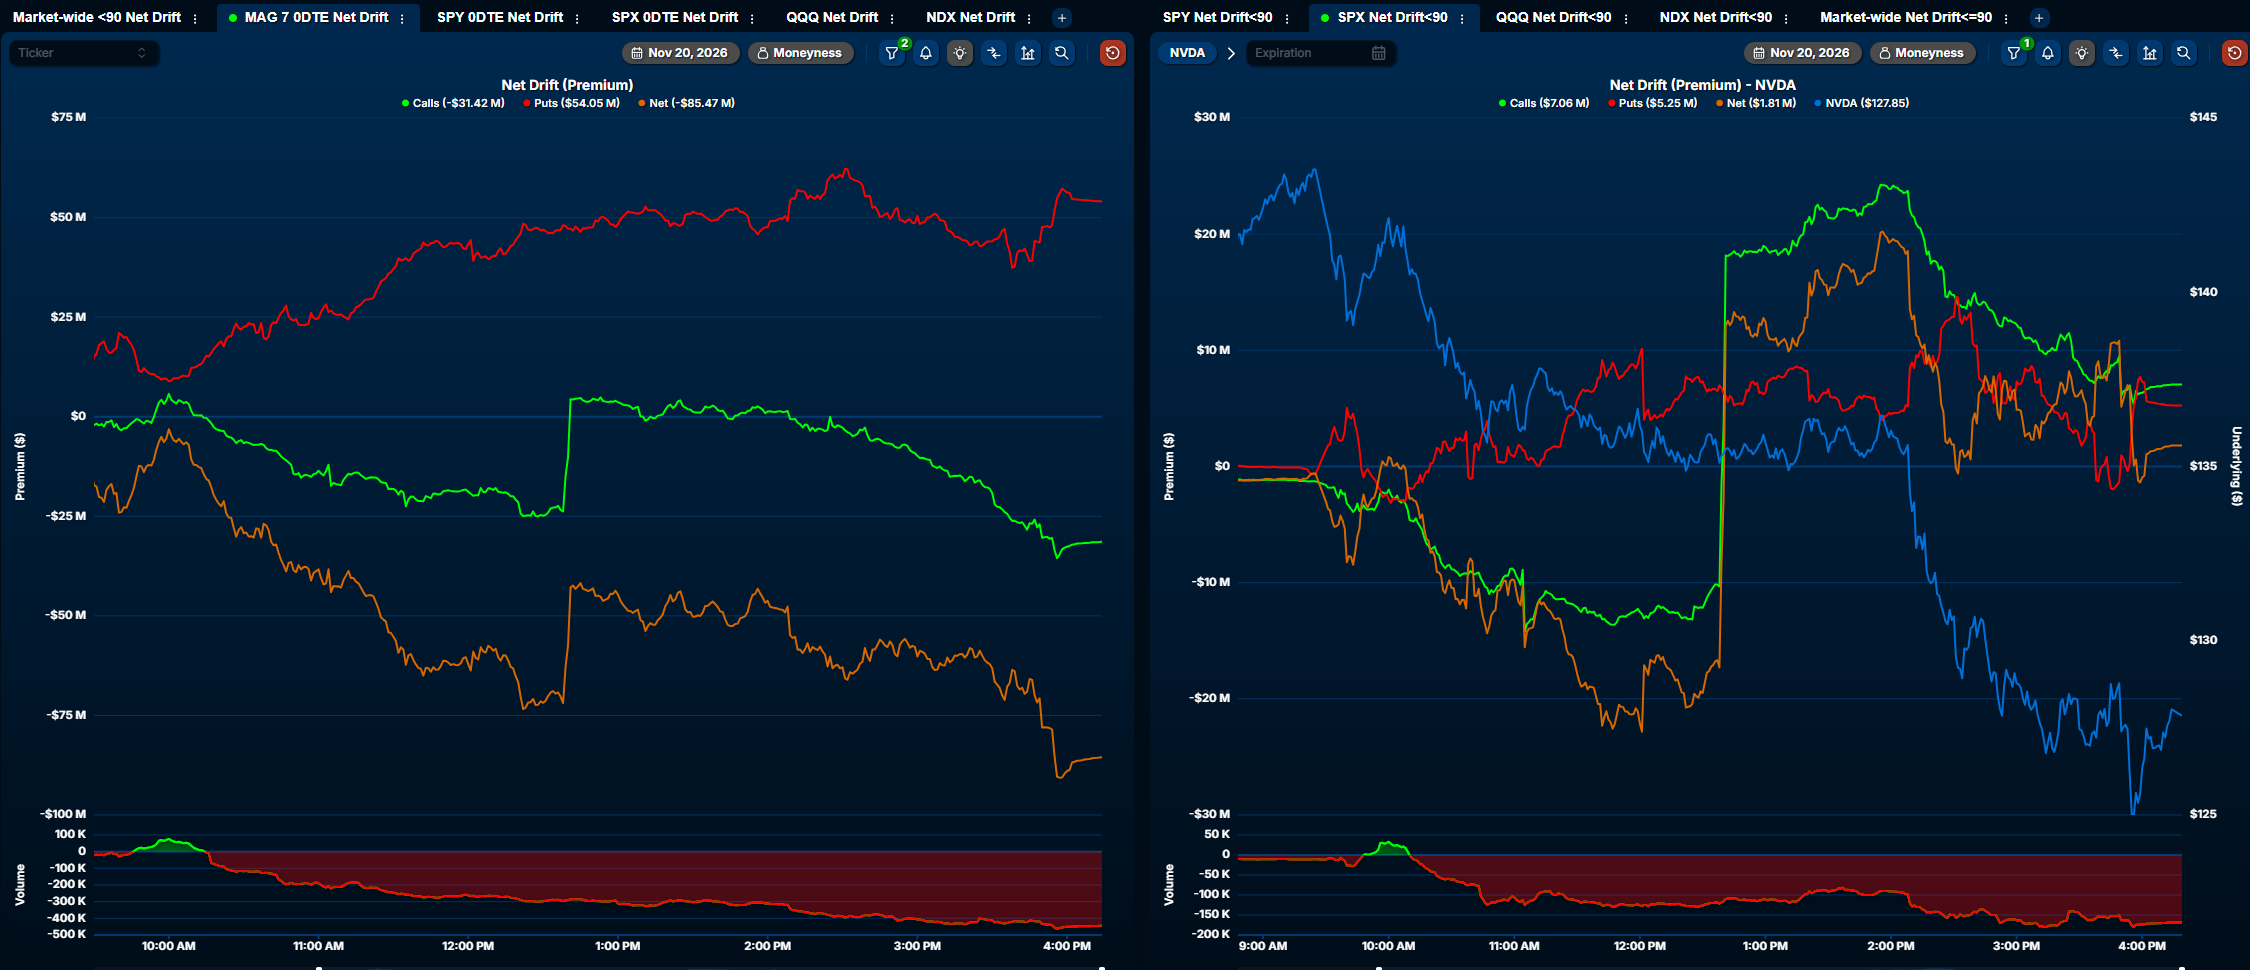
The MAG 7 net line ended at its low, at about −$85M. NVDA had a call surge around 13:00 ET that never lifted the price. (Source: QuantData Net Drift.)
Retail blinked first, maybe
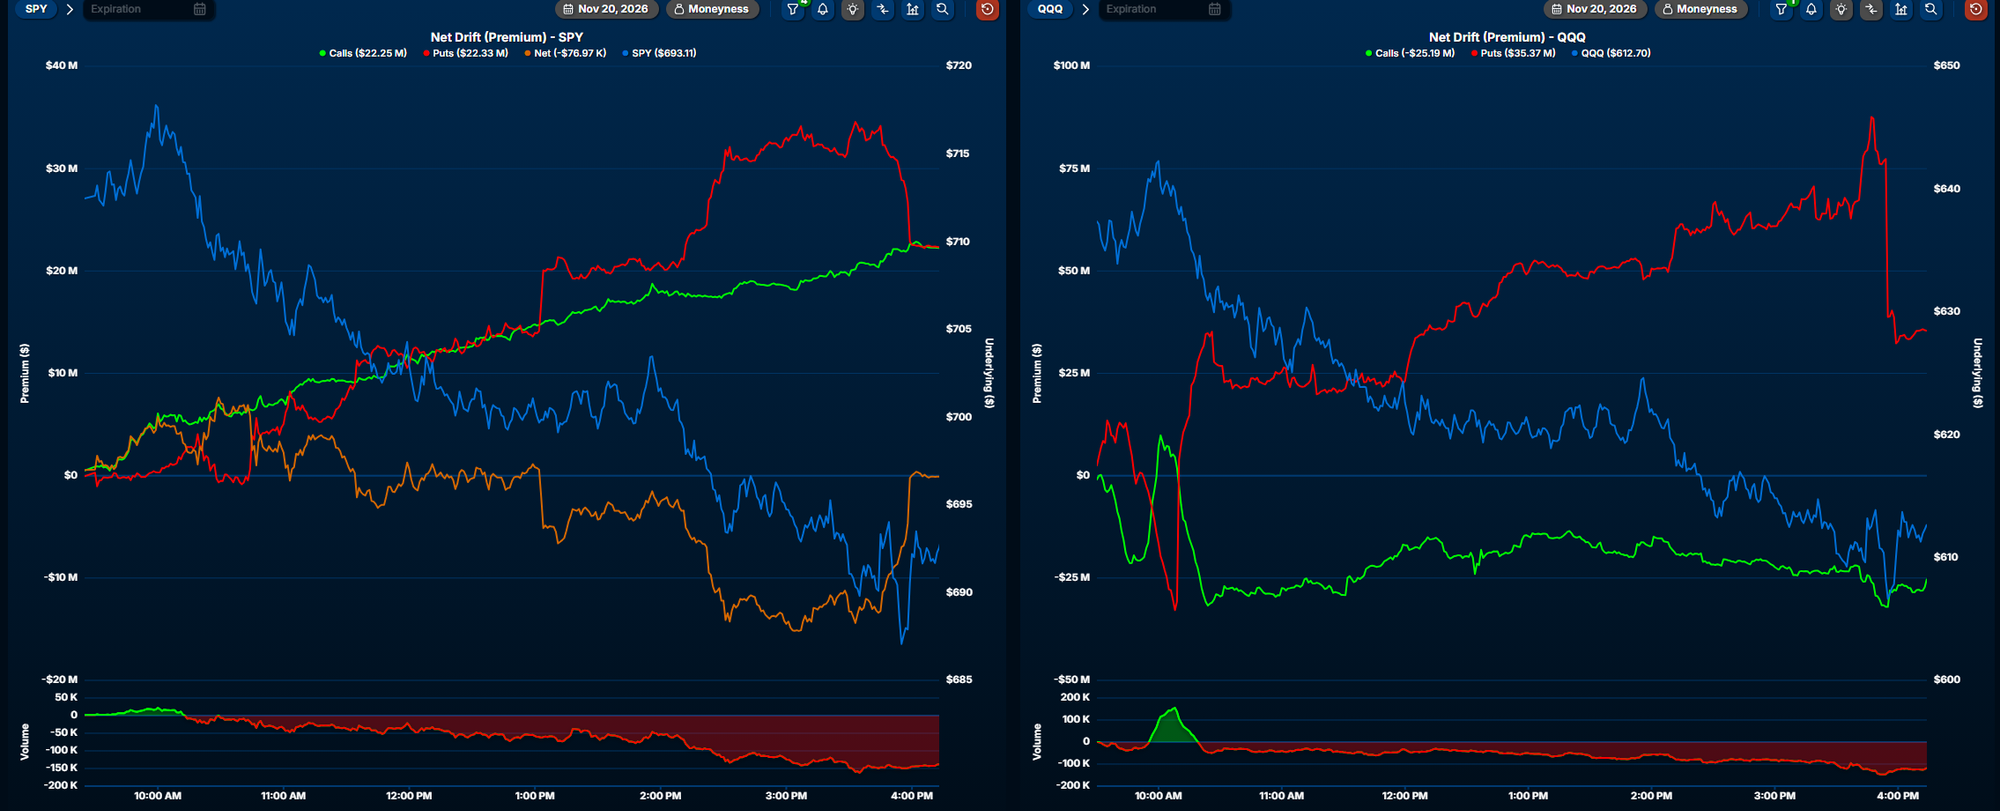
In SPY and QQQ, the exchange-traded fund (ETF) options where retail traders are most active, the last hour told a different story. In SPY, calls rose steadily through the day while puts surged after 13:00 ET, then were sharply unwound in the last half hour; the net line snapped back to about flat, and price bounced off its low. QQQ saw a big late put unwind with weak calls, and price ticked up into the close. That can look like retail capitulating first. On an Options Expiry day, though, part of it may simply be positions rolling to later dates, so we weight it lightly.
Research box
- Chen, Joslin and Ni found that public investors' net buying of deep out-of-the-money SPX puts is informative about future market returns, while the same measure built from SPY options showed no significant predictive power (working-paper comparison). Published as Review of Financial Studies (2019), doi:10.1093/rfs/hhy004.
- Chordia, Kurov, Muravyev and Subrahmanyam found that weekly net index put buying positively predicts the next week's S&P 500 return, more so when the VIX is high. In that sense heavy index put buying has been contrarian-bullish. Management Science (2021), doi:10.1287/mnsc.2019.3529.
- Baltussen, Da, Lammers and Martens found that last-30-minute moves driven by hedging tend to revert over the following days. Journal of Financial Economics (2021), doi:10.1016/j.jfineco.2021.04.029.
The lesson for next week: SPX flow carries more weight than SPY flow, and Friday's late-session selling under negative gamma is the kind of move that has tended to fade.
Second opinion
Second opinion (an Options Expiry specialist). Relief is the base case while the S&P 500 holds above 6825. But Friday's flows did not turn. The late SPX put buying was fresh hedging, rebuilding part of what expired. If price clears 6925, the negative zone above tends to let the move extend. If 6825 breaks, the 6500 to 6575 shelf is the next test.
In our strike table, the path from 6825 to that shelf is layered with smaller holds at 6800, 6725 and 6650, not an empty gap.
Two branches for next week
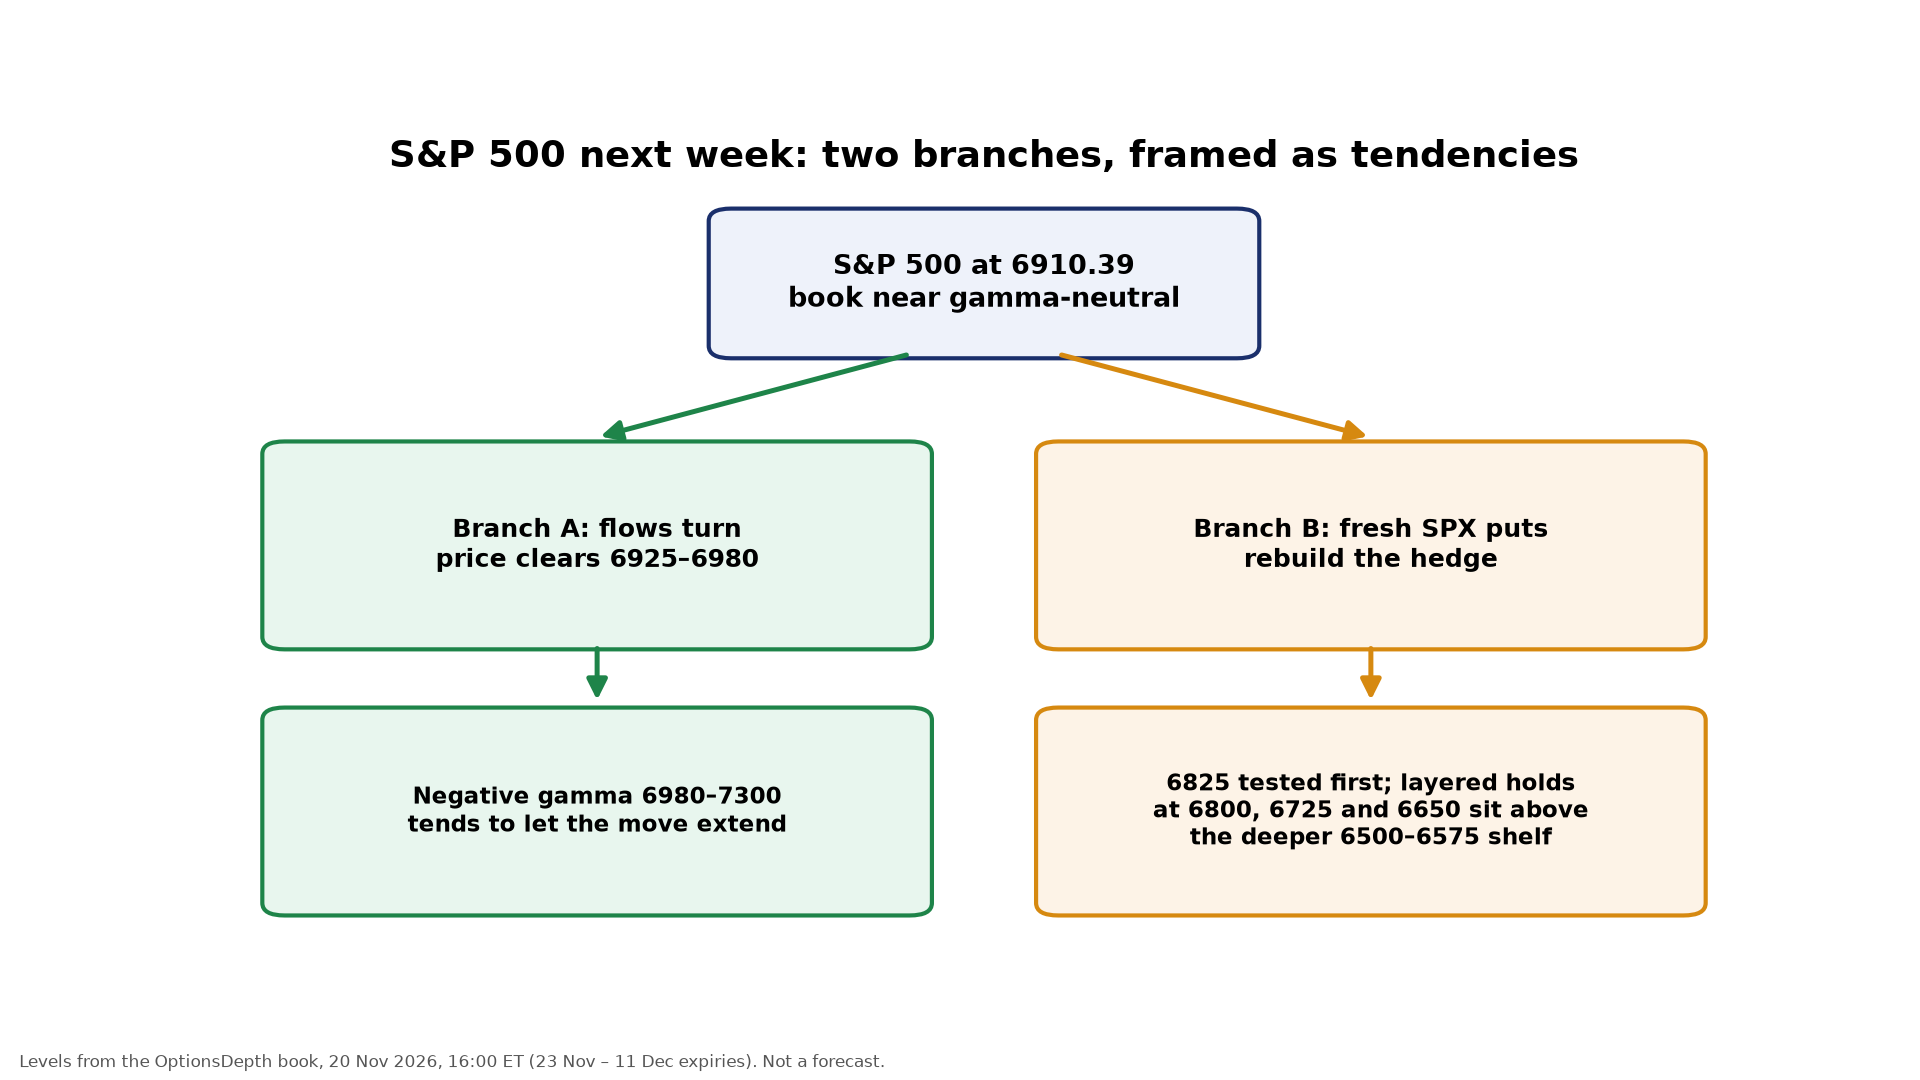
- Branch A, flows turn: price clears 6925 to 6980, and negative gamma up to 7300 tends to let the move extend.
- Branch B, fresh SPX puts rebuild the hedge: 6825 is tested first; below it, layered holds at 6800, 6725 and 6650 sit above the deeper 6500–6575 shelf.
The tell is the same in both: whether market-wide net drift turns up first and SPX put buying fades.
Thanksgiving week
The US market is closed on Thursday, 26 November, and closes early on Friday, 27 November. The 25 and 27 November expiries carry roughly two days of time decay across the holiday gap. Around price, charm leans slightly toward selling in the holiday week, so time decay on its own is not a tailwind. A relief move needs flows and price to turn together.
What we watch
Our daily 0DTE notes track these conditions live: whether vanna stays negative while the VIX rises, whether 6825 holds, and whether the flows finally turn up.
To get the next one in your inbox, sign up here: https://predictive-analytic-models-pam.ghost.io/#/portal/signup
Data: OptionsDepth snapshot 20 Nov 2026, 16:00 ET (market-maker Greeks, all-customer positions, 23 Nov to 11 Dec expiries). Index and volatility levels: Yahoo Finance. VEX, CEX and DEX are shown for direction only.
Educational only.
Copyright: Robert P. Balan (Nov 2026)