How to Read the S&P 500 0DTE EOD Recap: GEX, Vanna, Charm, Net Drift and the Visual Queue Map
How to read the Predictive Analytic Models end-of-day recap, plate by plate, and what each reading tends to mean for price, with a worked example from Friday 13 November 2026.
Every trading day we publish an end-of-day (EOD) recap of the S&P 500 index (SPX) and its zero-days-to-expiry (0DTE) options. This guide walks through its plates in film order, and what each one says about where price tends to go next. Every section ends with a For price: read. Each one is a tendency, not a call.
First, the words we use everywhere
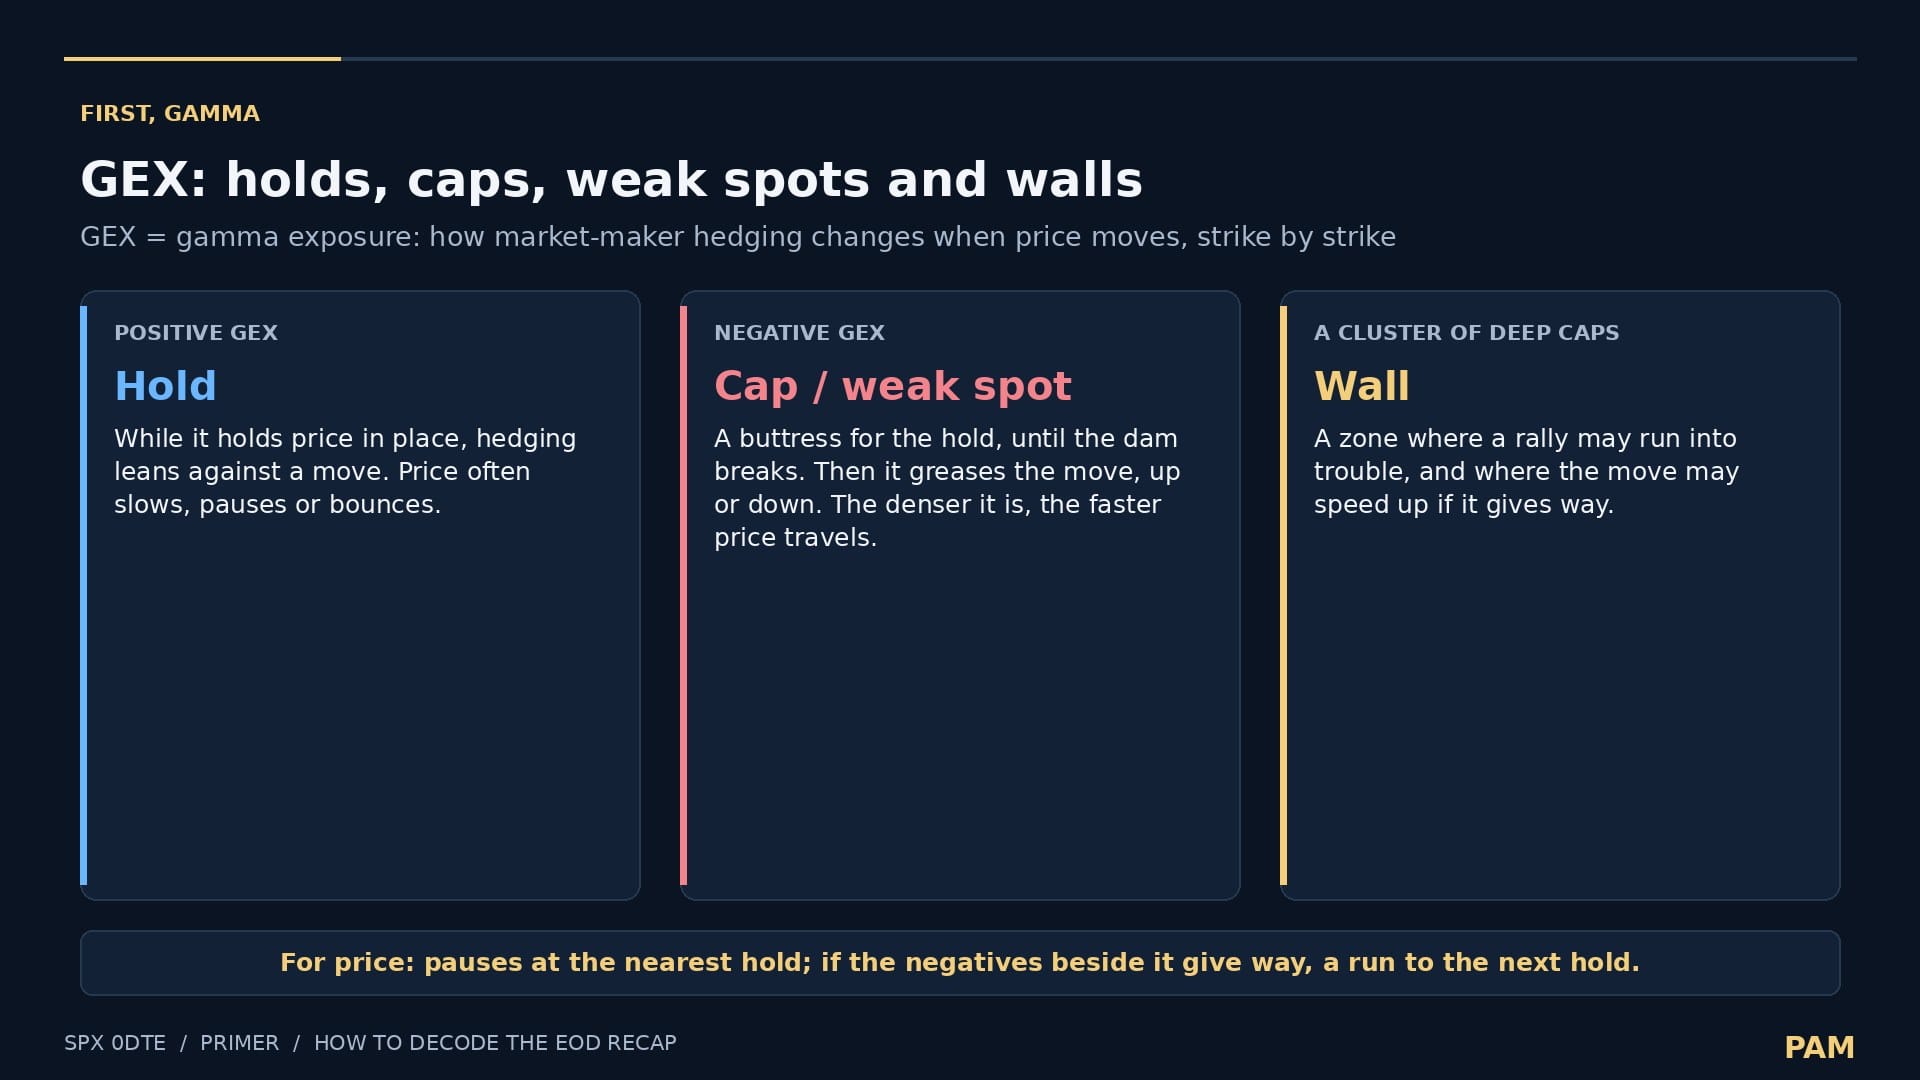
- GEX (gamma exposure) is how much market makers have to buy or sell as price moves, strike by strike, in $ million per point. We show it for the market makers' side of the book.
- Hold is a strike with positive GEX. While it holds price in place, market-maker hedging there leans against moves, so price often slows, pauses or bounces at a hold.
- Cap (above price) or weak spot (below price) is a strike with negative GEX. At first, negative GEX works like a buttress for the nearby hold and helps keep price contained. That lasts until the dam breaks. Once price pushes through, the negative GEX does the opposite: it greases the move, up or down, and the denser the negative GEX, the faster price tends to travel through it. A cluster of deep negative strikes above price is what we call a wall: a zone where a rally may run into trouble, and where the move may speed up if the wall gives way.
For price: price tends to pause or bounce at the nearest hold. If the negative GEX next to it gives way, the move tends to run quickly to the next hold beyond it, and the denser the negative strikes in between, the faster.
How VEX and charm stack on top of GEX
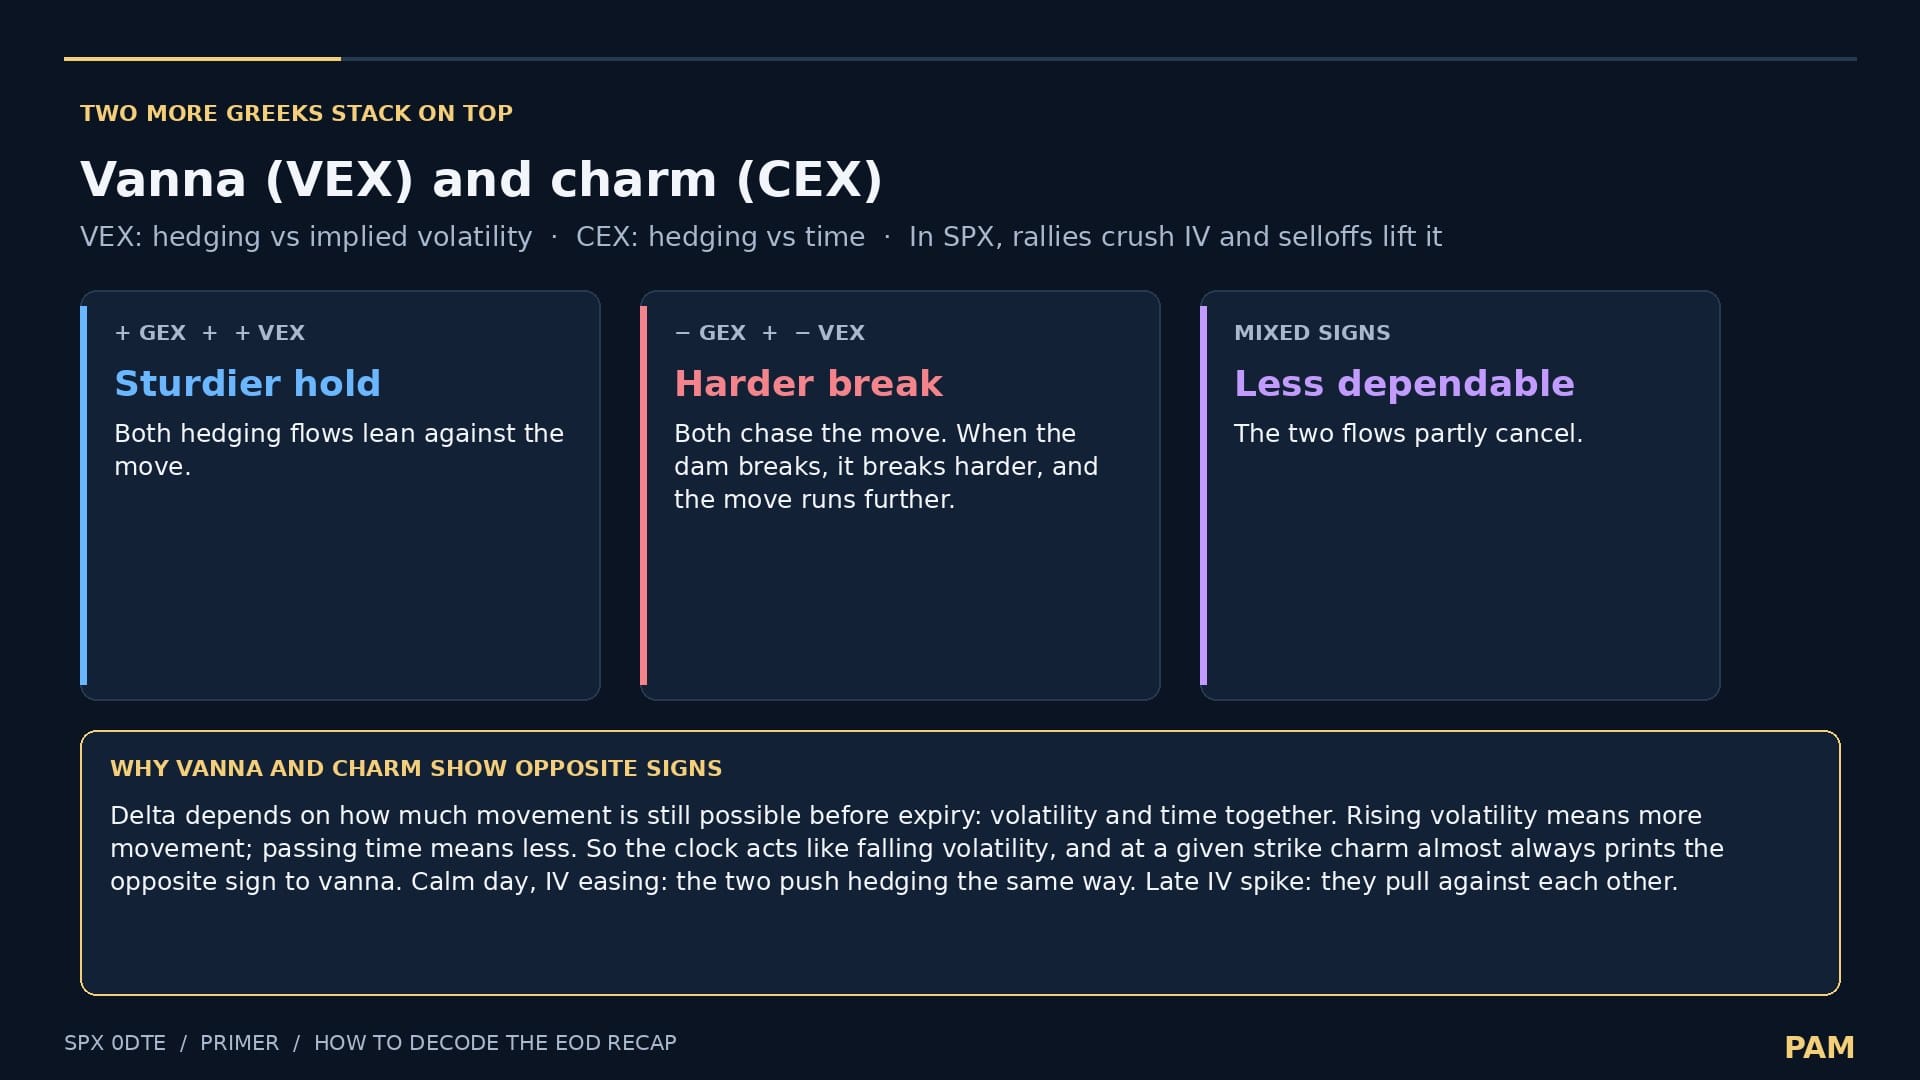
GEX tells you how market-maker hedging changes when price moves. VEX (vanna exposure) tells you how that hedging changes when implied volatility (IV) moves. In SPX the two usually move in opposite directions: rallies tend to crush IV, and selloffs tend to lift it. So a single price move usually triggers both kinds of hedging at once, and the signs at a strike tell you whether they work together:
- Positive GEX + positive VEX: both hedging flows lean against the move. That makes for a sturdier hold.
- Negative GEX + negative VEX: both hedging flows chase the move. When the dam breaks, it breaks harder, and the move tends to run further.
- Mixed signs: the two flows partly cancel each other, so the level is less dependable.
Charm (CEX) is how delta changes as time passes. On 0DTE options, time is short, so the charm unwinding builds into the close.
These are tendencies, not guarantees. Each recap shows how they actually worked that day.
Why VEX and charm show opposite signs
An option's delta depends on how much movement is still possible before it expires, and that comes from volatility and time together. VEX measures how delta changes when volatility rises, which means more possible movement. Charm measures how delta changes as time passes, which means less possible movement. So the clock running down acts like a drop in volatility. Both pull the same lever, in opposite directions, so at a given strike charm almost always prints the opposite sign to VEX.
Practical read: on a calm day, with IV drifting lower and the clock running, the vanna and charm flows push dealer hedging the same way. They pull against each other when IV rises late in the day, for example during a selloff that bids up volatility.
Caveat: the relationship is exact in the standard option-pricing model and holds almost always in practice. Very short-dated, far out-of-the-money strikes can occasionally bend it.
What it means for price
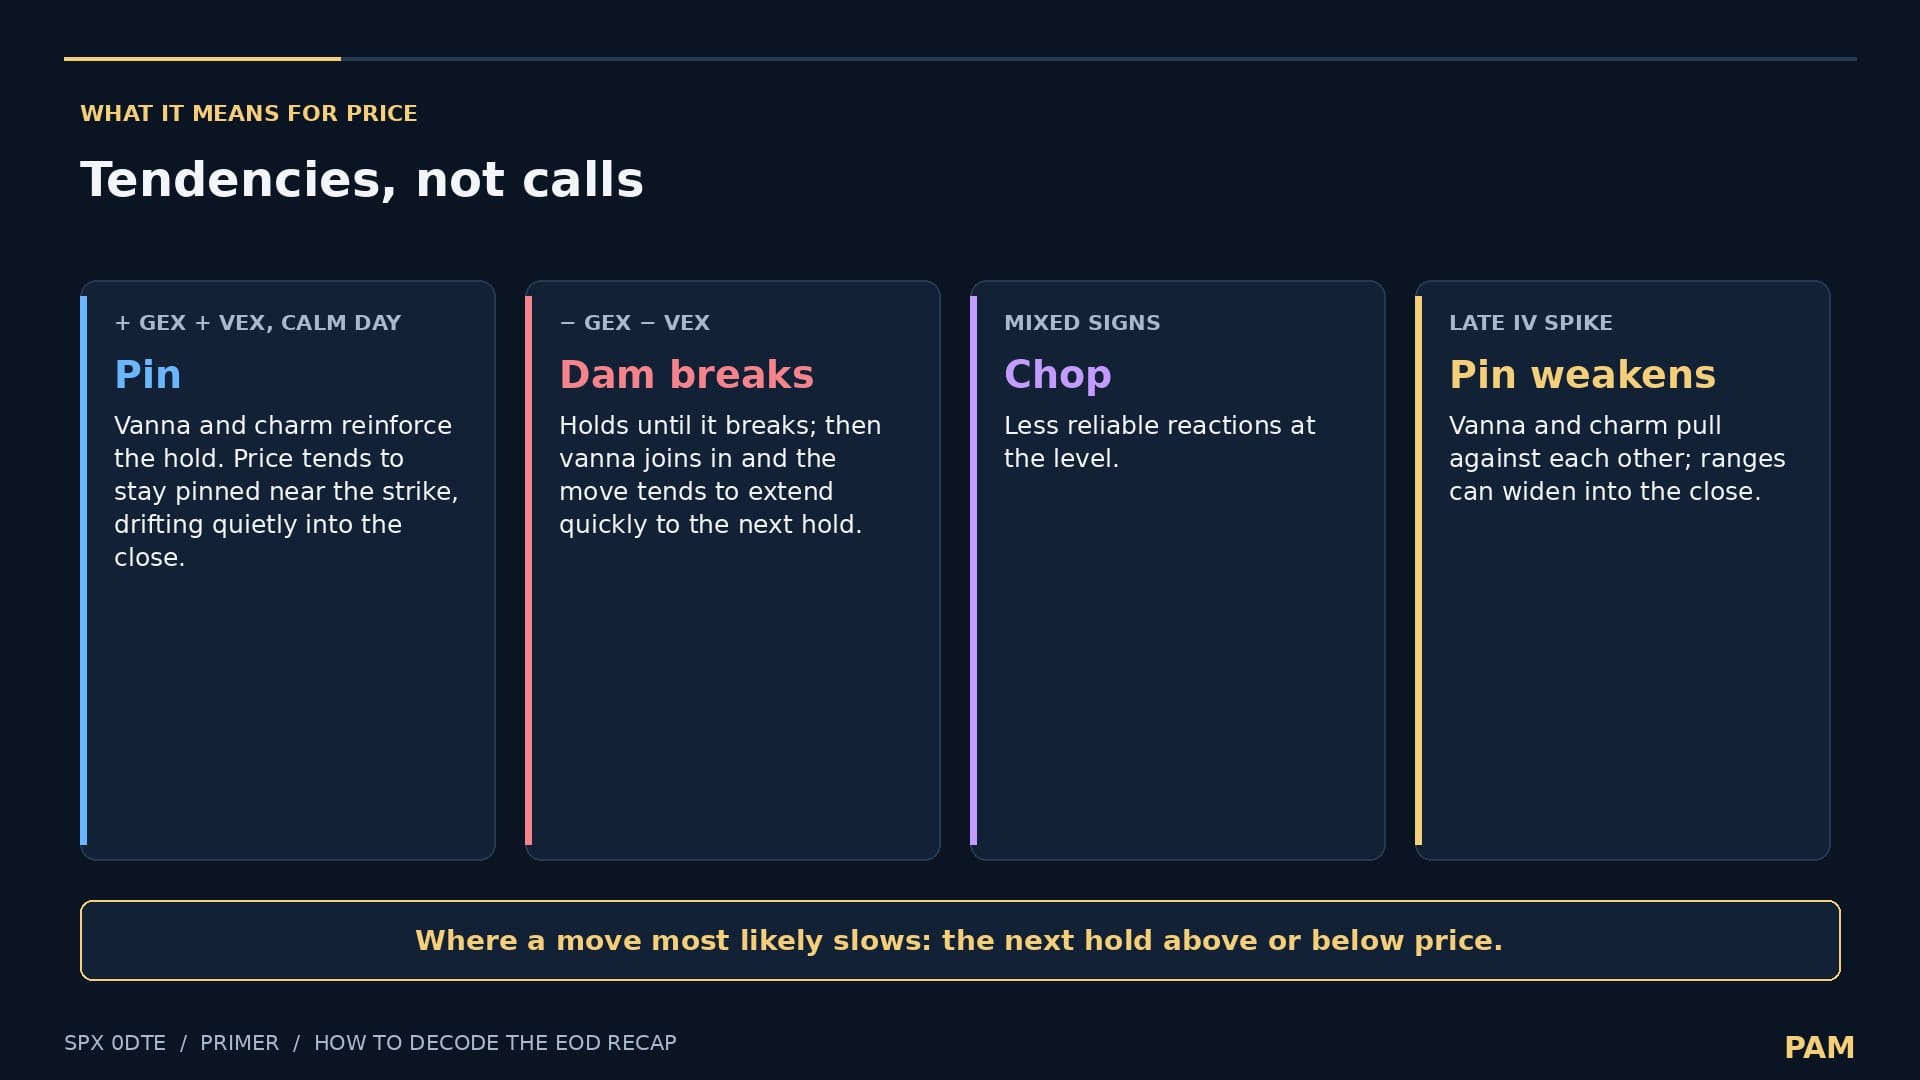
These are tendencies, not calls. They describe how hedging flows often shape price behaviour around a strike.
- Positive GEX + positive VEX at a strike near price, on a calm day. IV is easing and the clock is running, so the vanna and charm flows reinforce the hold. Price tends to stay pinned near that strike, with a quiet drift into the close.
- Negative GEX + negative VEX. The level holds until the dam breaks. Once it breaks on the downside, rising IV adds vanna selling to the hedging. On an upside break, falling IV adds vanna buying instead. Either way, the move tends to extend quickly toward the next positive-GEX hold.
- Mixed signs. Expect chop, and less reliable reactions at the level.
- A late-day IV spike while time runs out. Vanna and charm pull against each other, so afternoon pin behaviour weakens and ranges can widen into the close.
Where a move most likely slows: look for the next hold above or below price, the next strike with positive GEX. Those are the levels each recap and Game Plan names.
For price: when the signs match, a level tends to be more decisive, either a firmer pin or a faster break. When they're mixed, reactions tend to be noisier and shorter-lived.
Customer calls and puts: where customers are positioned
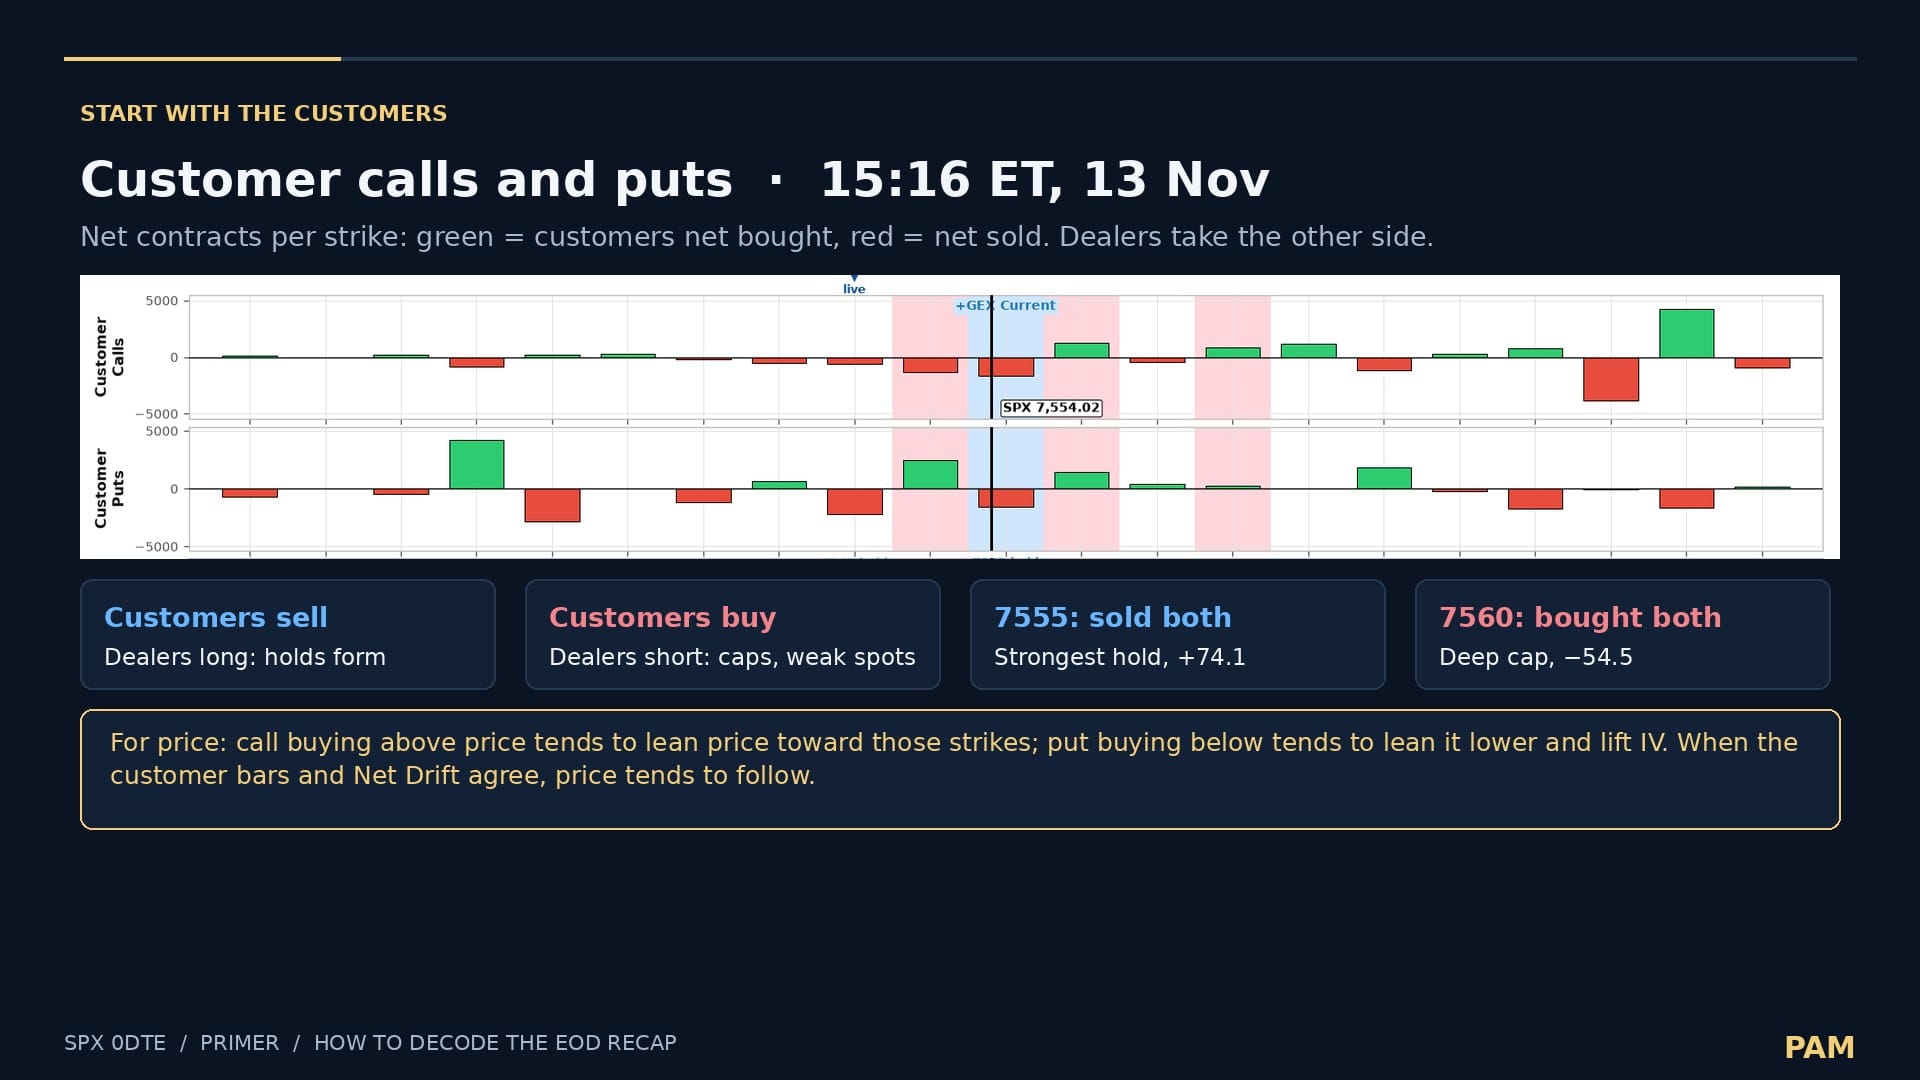
The top two Queue Map panels show net customer contracts at each strike, calls in one row and puts in the other. Green means customers are net buyers there, and red means they are net sellers. Market makers sit on the other side of those trades. Where customers buy options, dealers end up short them, which is usually where negative GEX comes from. Where customers sell, dealers end up long, which builds positive-GEX holds.
- Call buying above price, put selling below: customers leaning bullish.
- Put buying below price, call selling above: customers leaning bearish, or hedging.
- Distance from price: concentrations near the print matter most. Across snapshots, watch whether the bought strikes migrate toward price or away from it.
For price: strikes where customers sold both calls and puts tend to become holds that pin price. Strikes where they bought both tend to become caps or weak spots, where a break speeds up. Call buying above price tends to lean price toward those strikes, and put buying below tends to lean it lower and lift IV. When the customer bars and Net Drift agree, price tends to follow. On 13 Nov at 15:16 ET, customers sold both at 7555, the strongest hold at +74.1, and bought both at 7560, a deep cap at −54.5.
Plates 1–2. The story line and the session chart
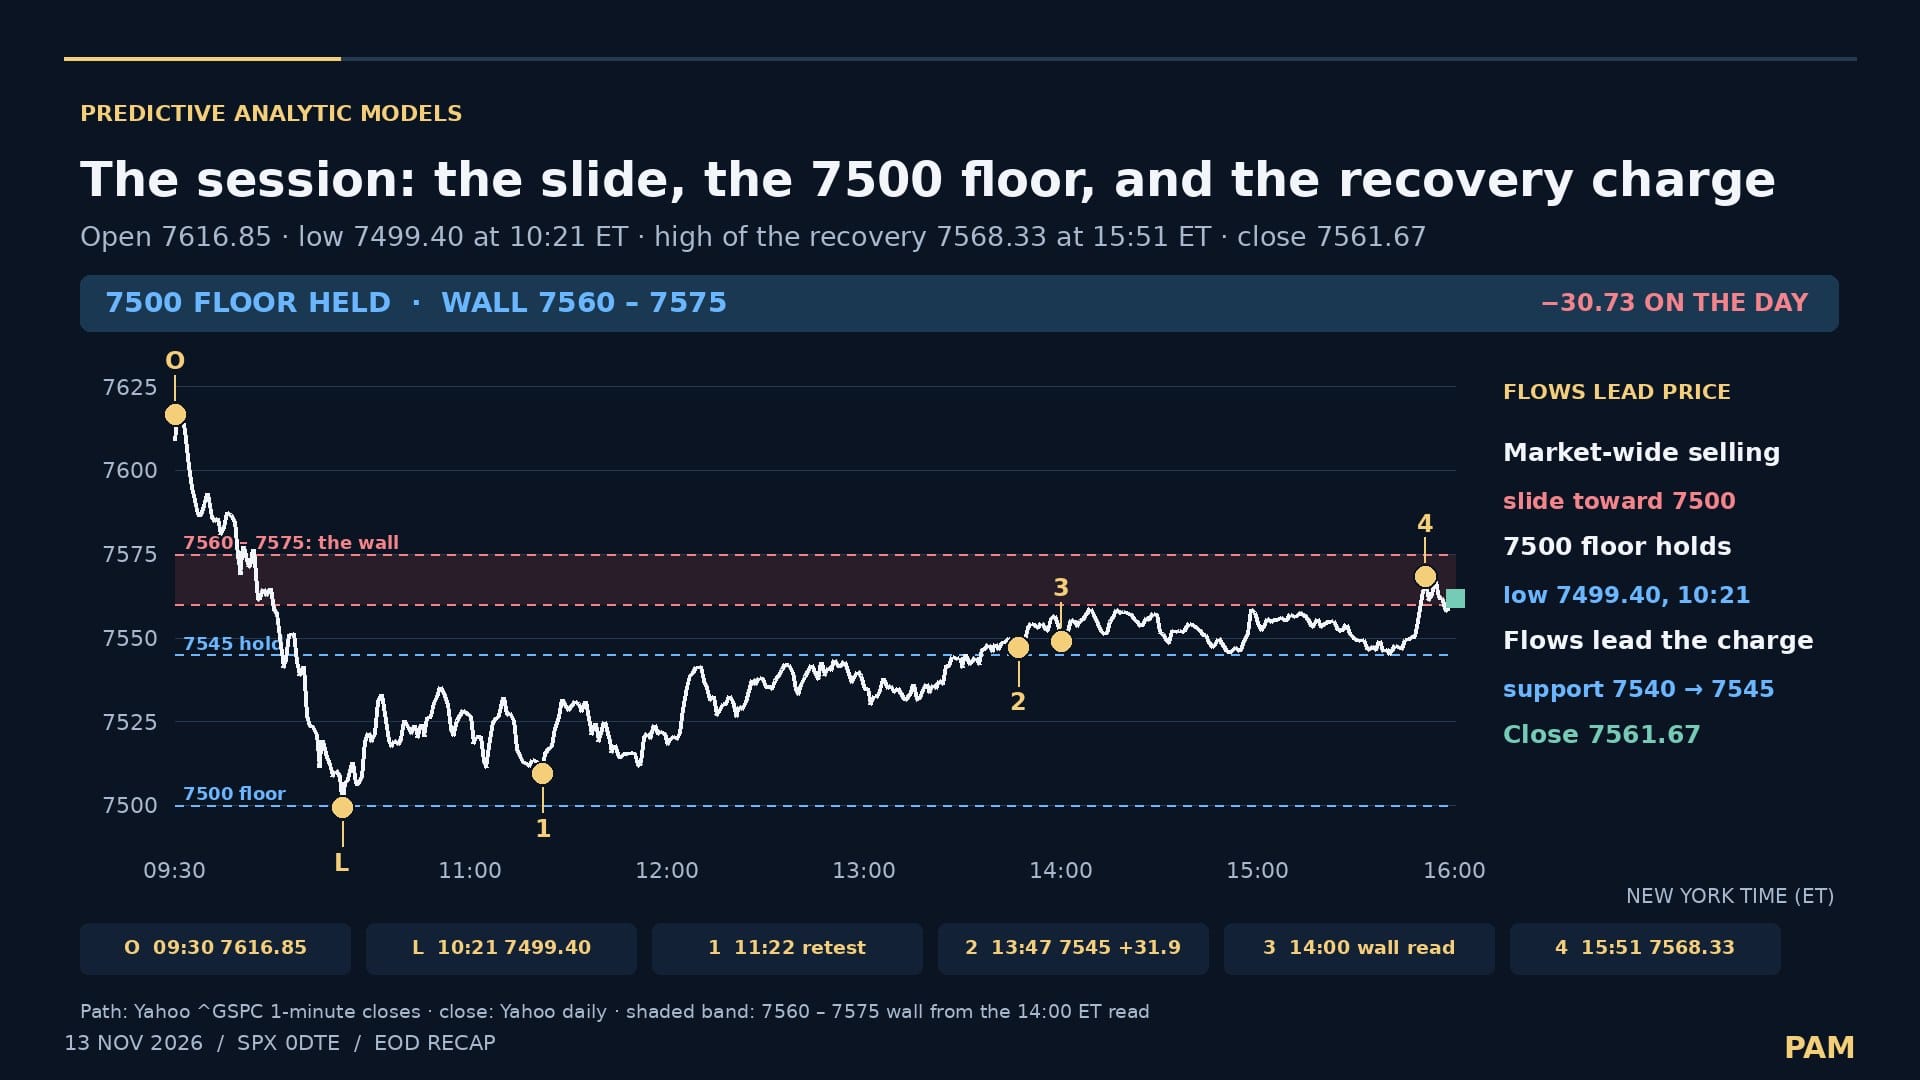
What you see: first, the day's main lesson in one line, stated before any chart. Then the SPX 1-minute path from the 09:30 ET open to the 16:00 ET close. Gold numbered dots mark key moments, explained in the boxes along the bottom. Dashed lines show the levels that mattered: blue for holds and red for negative levels, with any wall shaded. The right-hand column tells the story in short steps. How to use it: hold the one-line story as a question and test it against every plate that follows. Find where price turned, and check whether it turned on a dashed line.
For price: turns that land on a book level show the hedging was doing the work. Those levels tend to stay relevant into the next session until the book redraws them.
Plates 3–5. GEX snapshots: what changed
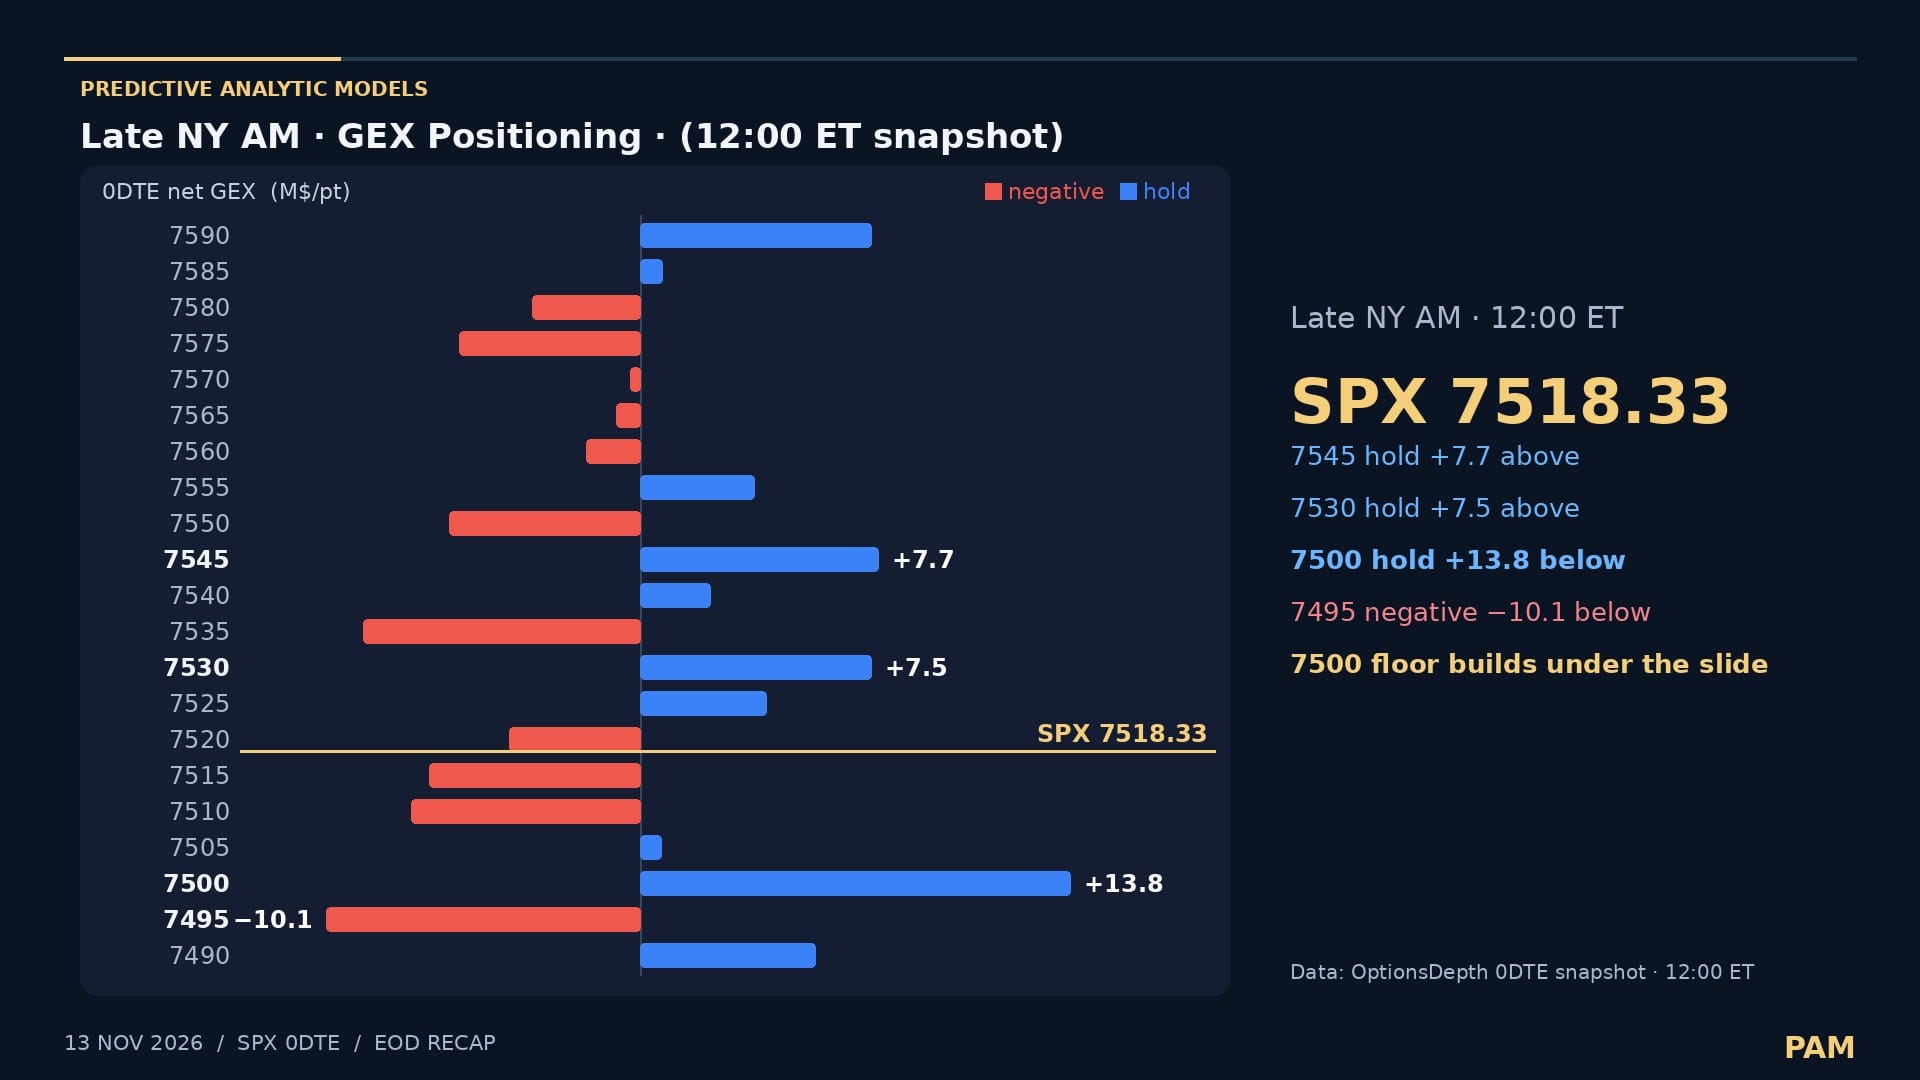
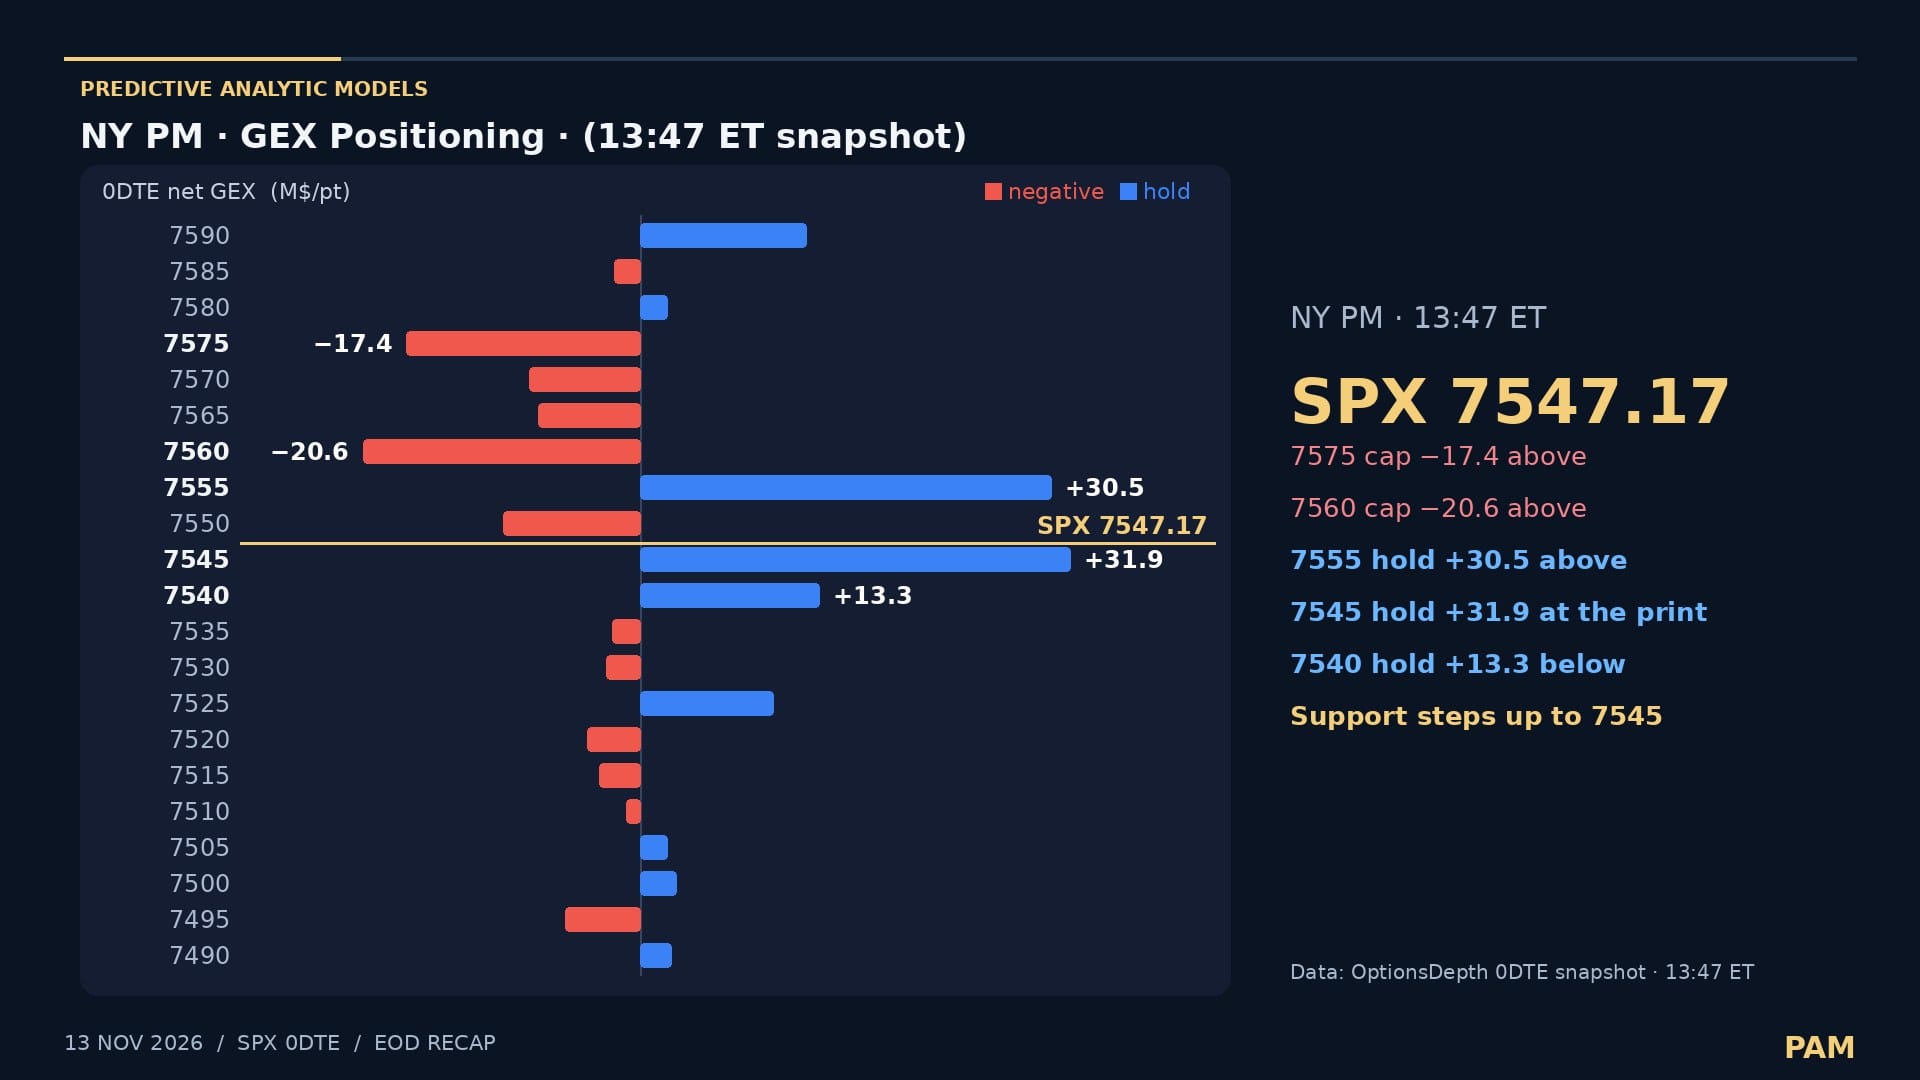
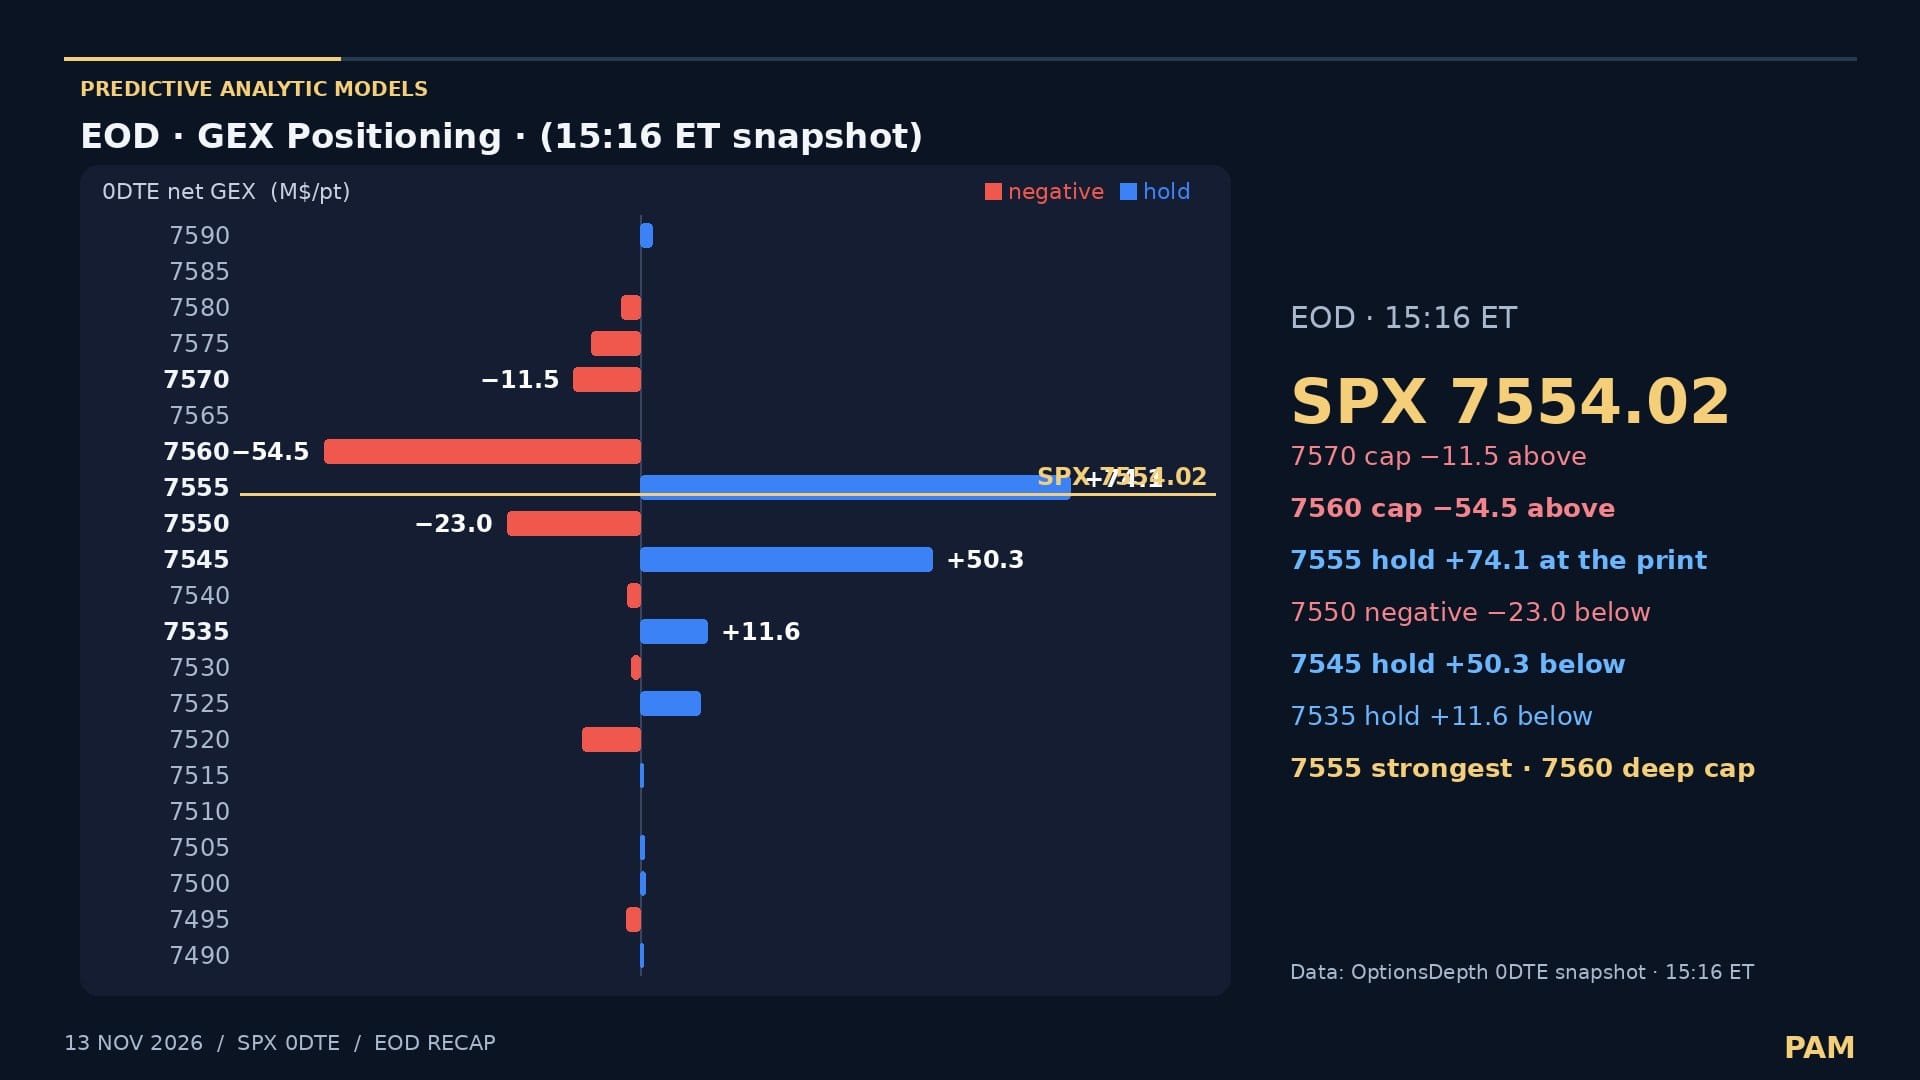
What you see: a horizontal bar for every strike in the 0DTE book. Blue bars to the right are holds (positive GEX), and red bars to the left are negative GEX. A gold line marks the print at the snapshot time, and the right-hand panel lists the strikes that matter, with their values. How to use it: find the largest blue bar near the print, the hold doing the work, and the deepest red bars above it, the cap or wall. Then compare the snapshots in time order.
For price: when holds step up behind price, dips tend to stay shallow and price tends to grind higher. When holds fall away under price, dips tend to run to the next lower hold.
Plate 6. QuantData Net Drift: flows lead price
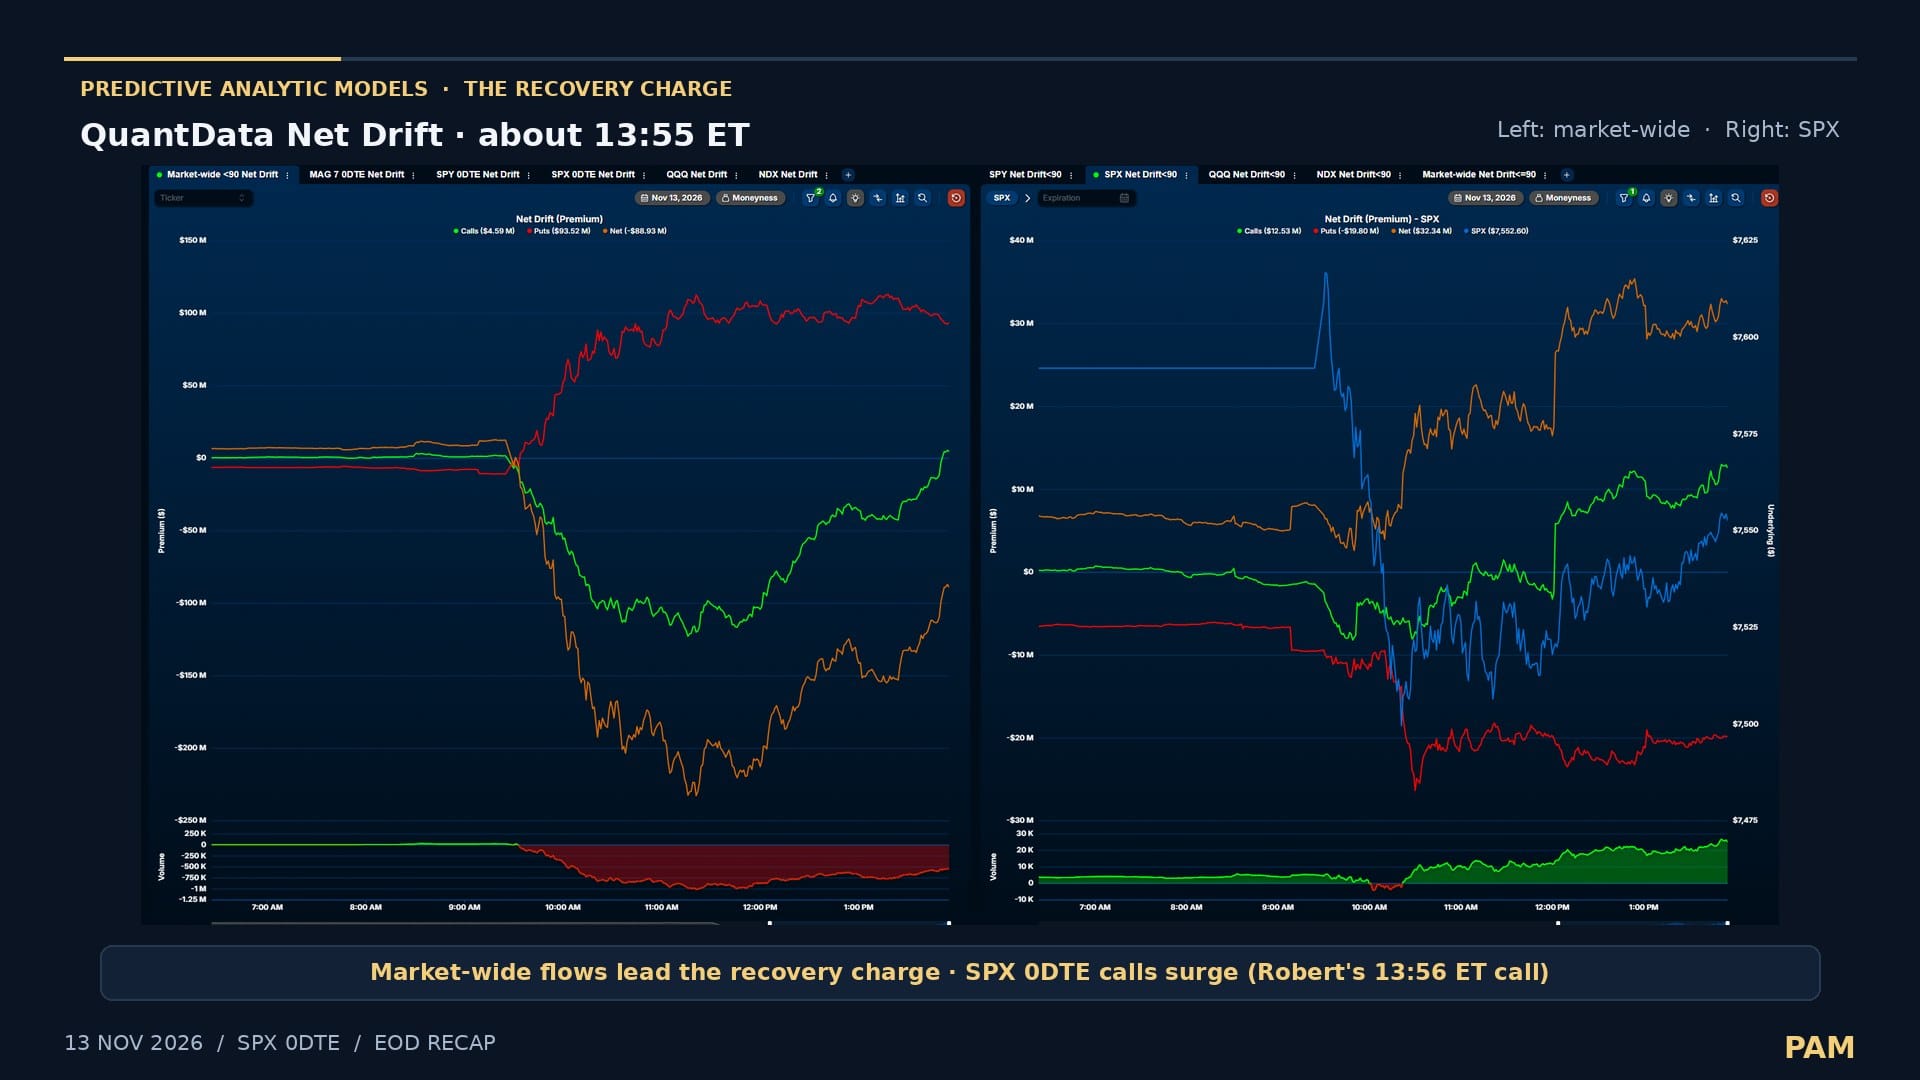
What you see: Net Drift is a running total of option premium, with market-wide on the left and SPX on the right. Green is call premium, red is put premium and orange is the net. On the SPX panel the blue line is the SPX price, and the bars at the bottom are volume. When calls climb and put premium fades, the net rises. When put premium climbs, it falls.
The market-wide panel shows the broader trend of the day, and price tends to follow it over the session. SPX is the market's favored hedging instrument and has a narrower scope, so a major turn in the prevailing trend tends to show up first in SPX flows, even when volume is thin. Most splits between the two panels come from that hedging role. On 12 November, for example, the SPX flows faded first, the market-wide flows rolled over next, and the day's high was already in.
For price: follow the market-wide panel for the day's trend. When market-wide net premium turns up while price is still falling, a turn higher tends to follow, and when it rolls over near the highs, a top tends not to be far behind. Treat a persistent SPX split as an early warning of a possible turn.
Plate 7. The afternoon read: the wall
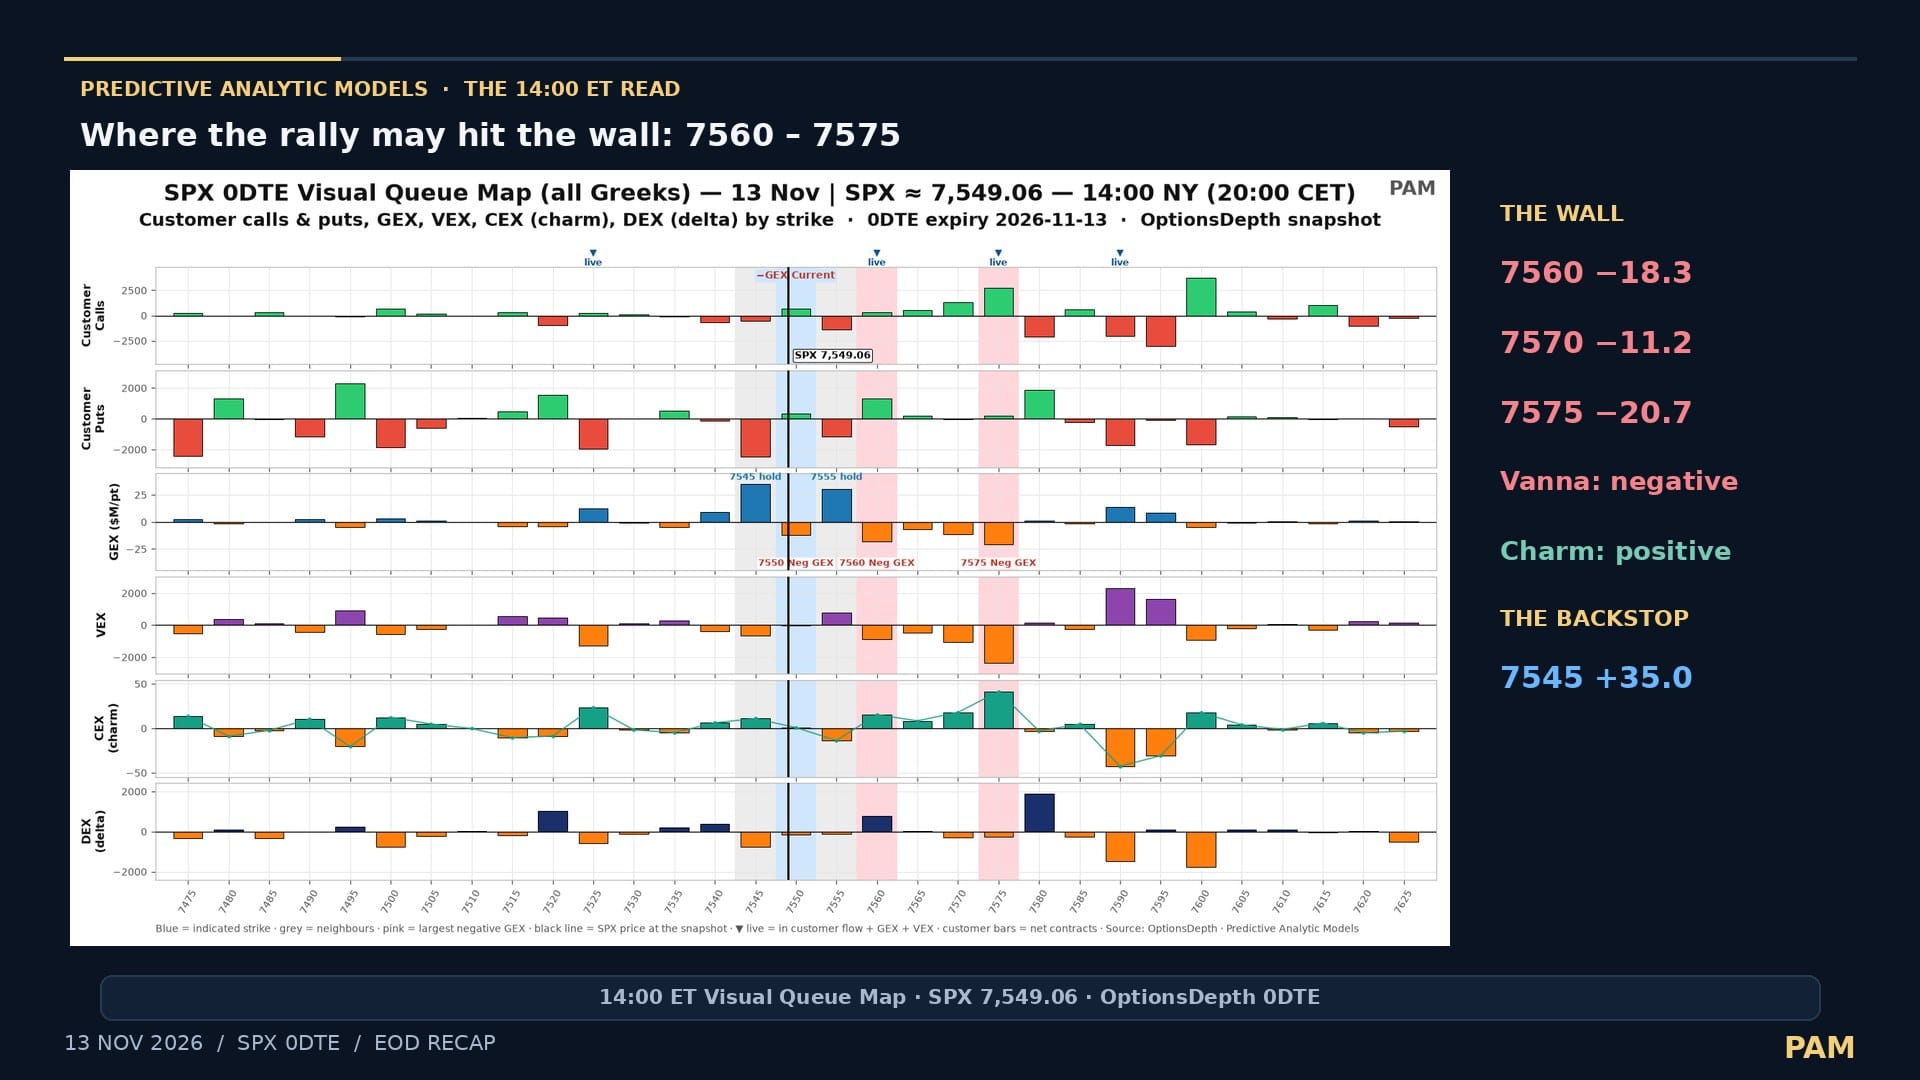
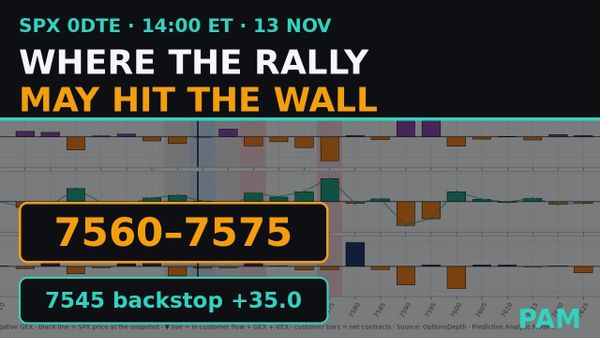
What you see: the Visual Queue Map at 14:00 ET, with the wall strikes and their values listed on the right, plus the vanna and charm direction there. It answers the question the afternoon note asked in real time: if the move continues, where may it run into trouble? How to use it: read the wall as a zone, not a single price, and check later in the recap whether the zone did its job.
For price: into a wall, rallies tend to slow and chop. If the wall gives way, especially with negative vanna, the move tends to speed up to the next hold above.
Plate 8. The six-panel Visual Queue Map
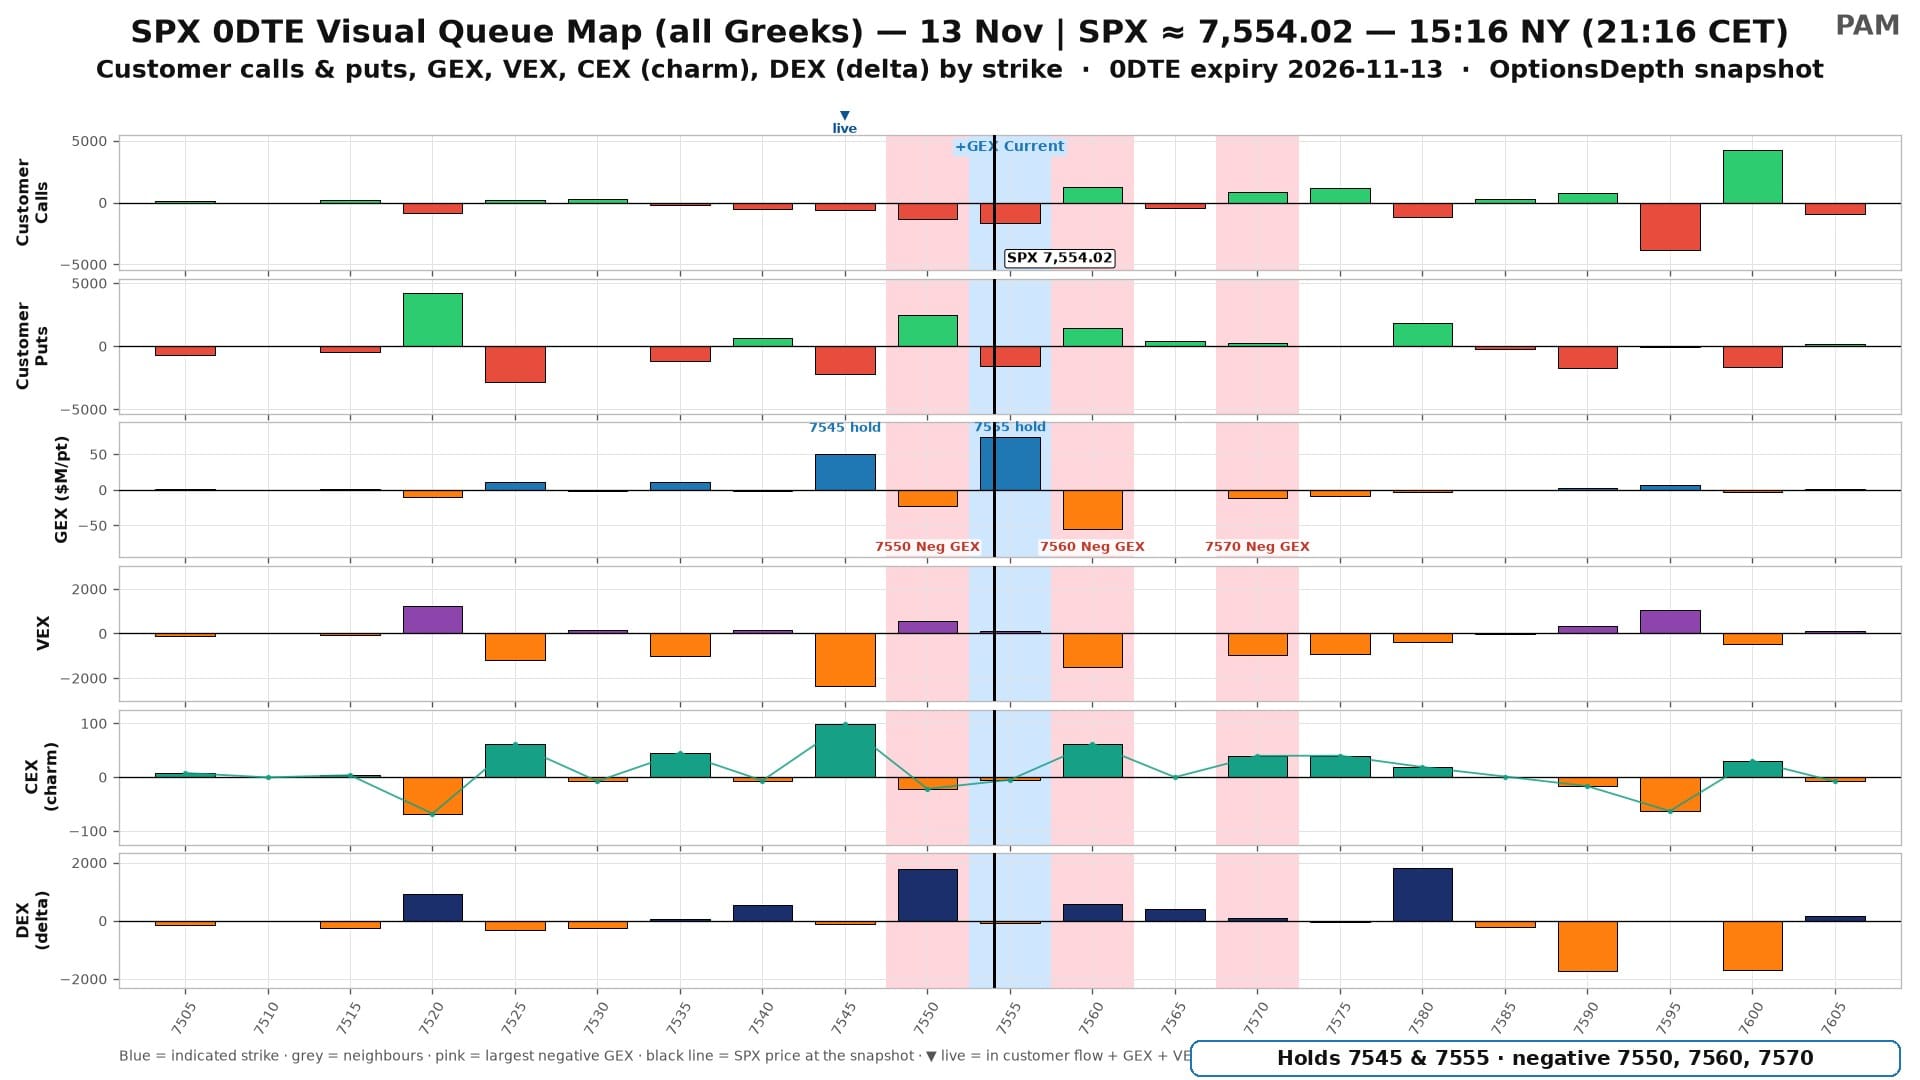
This is the densest plate. The six panels share one strike axis, so read straight down a column.
- Customer calls and 2. customer puts: net contracts, green bought and red sold (see the section above).
- GEX: blue is positive (hold), orange is negative.
- VEX (vanna): purple is positive, orange is negative.
- CEX (charm): teal is positive, orange is negative. The thin line through the bar tops is the charm "wave", and it shows where the sign swings from one side to the other.
- DEX (delta): navy is positive, orange is negative. See the appendix.
The black vertical line is the SPX price at the snapshot. The light-blue column is the strike nearest price, and the label above it gives that strike's GEX sign. Light-grey columns are its neighbours, and pink columns are the three most negative GEX strikes in view. Blue "hold" tags mark the two largest holds. Start with the customer rows, then read down each column. For VEX and CEX, read the sign and the relative size, not the units.
What "live" means. The marker is computed by the chart code. It takes a window of strikes around price (7505–7605 on the 13 Nov 15:16 ET map) and finds each row's largest bar by size, ignoring sign. A strike is significant in a row if its bar is at least 35% of that largest bar. It is live when it is significant in customer flow (calls or puts), GEX and VEX at once. Because the cut-off is relative, it scales with each day's book, and only the few strikes big in all three rows qualify. A live strike can be a hold or a cap. 35% is a working cut-off: low enough to catch every strike that dominates its row, high enough that only a handful qualify in all three at once. At 15:16 ET only 7545 was live: customers had sold 2,210 puts, GEX was +50.3, and its VEX was the window's largest, negative.
For price: where customer positioning and two kinds of dealer hedging are all heavy, price tends to react most clearly. On 13 Nov, 7545 caught the 15:41 ET dip at 7,544.35. Strikes strong in several rows tend to give a firm pin or a break that runs. Single-row strikes tend to give weak reactions.
Plates 9–10. Into the bell, and the closing captures
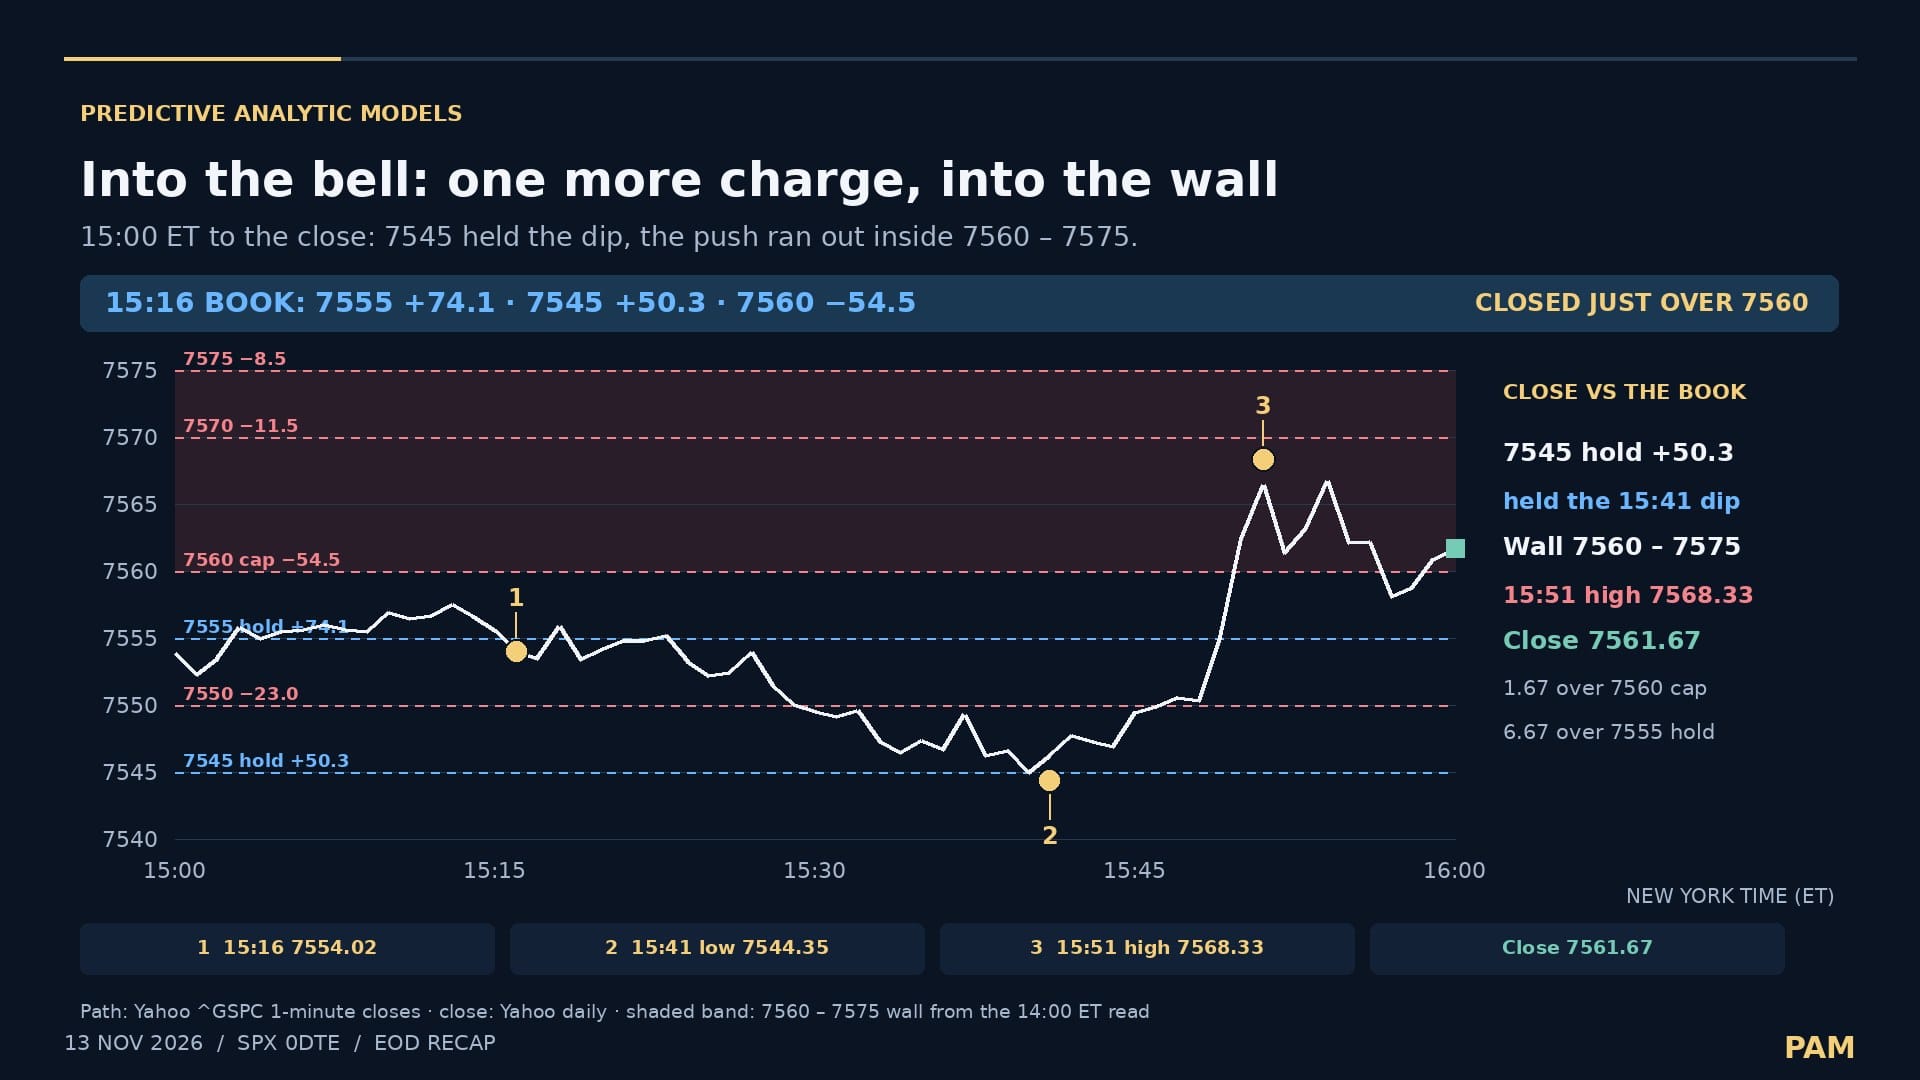
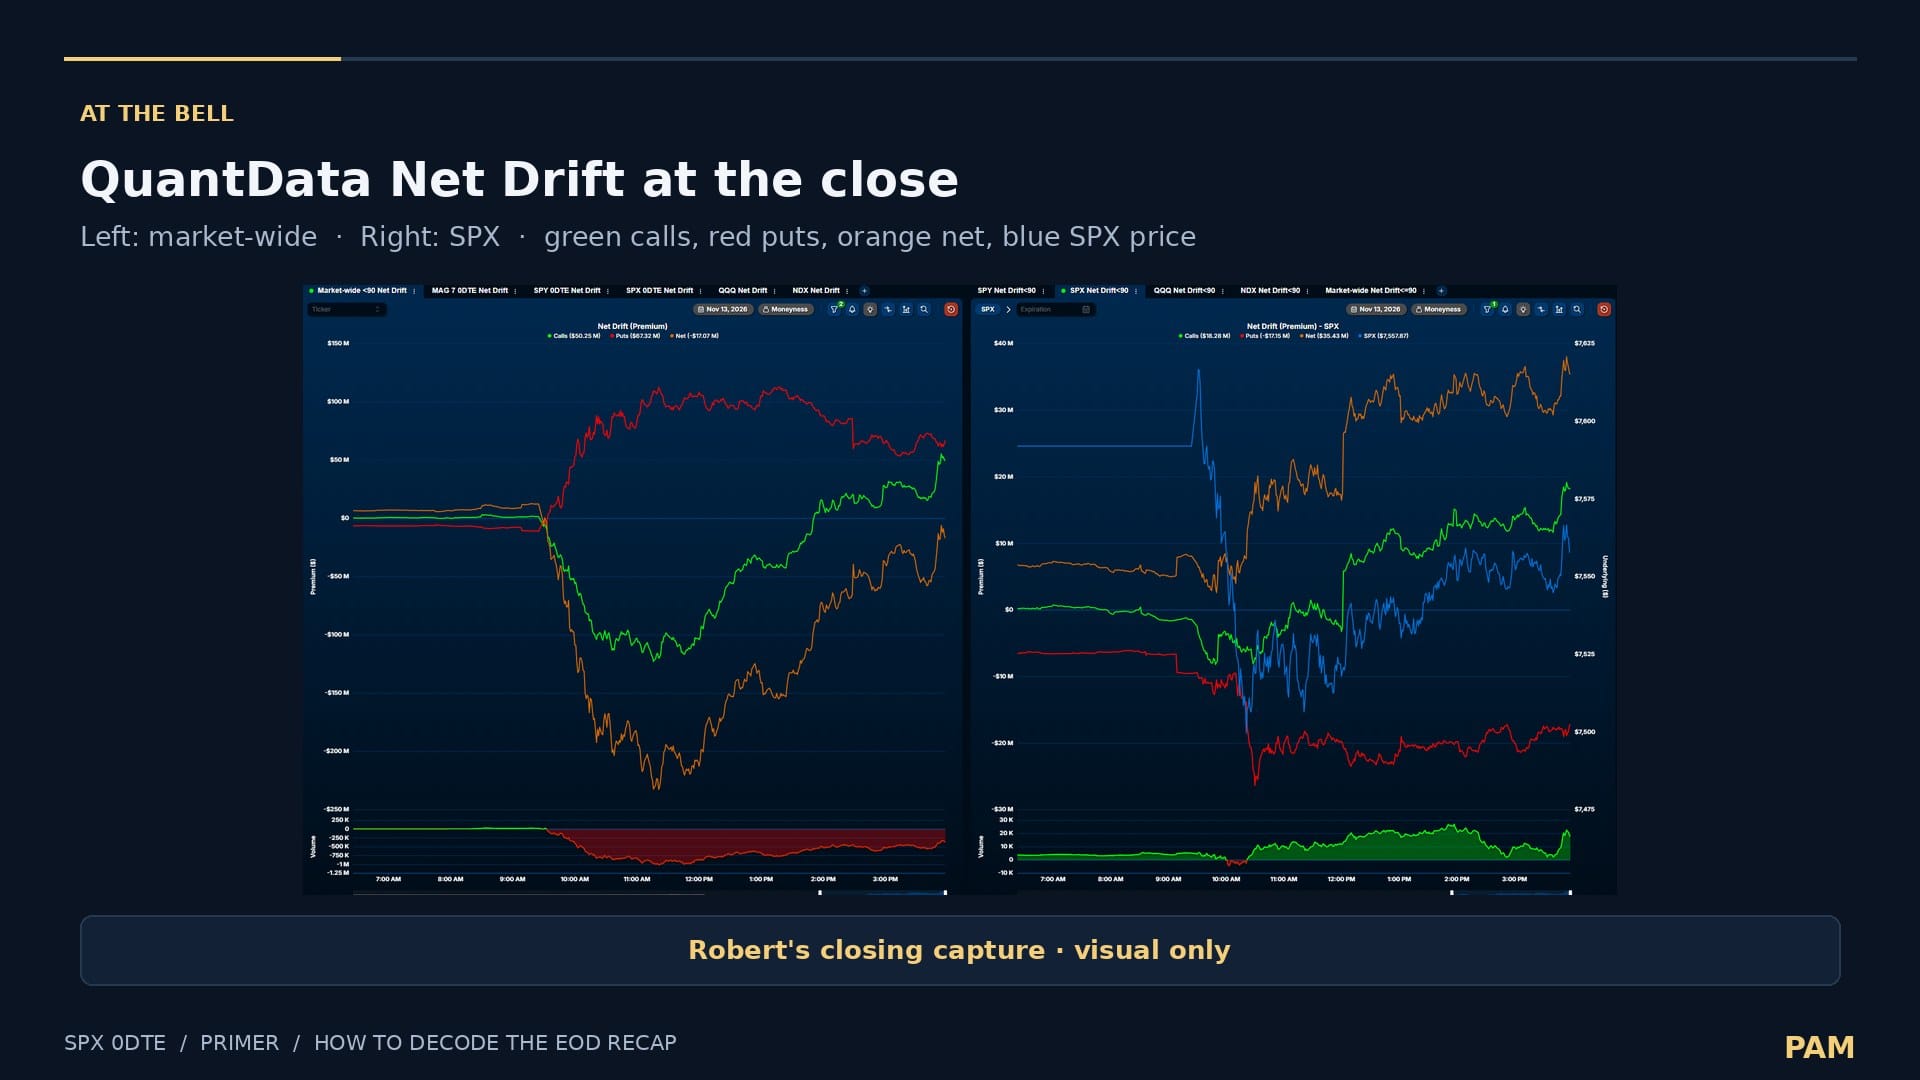
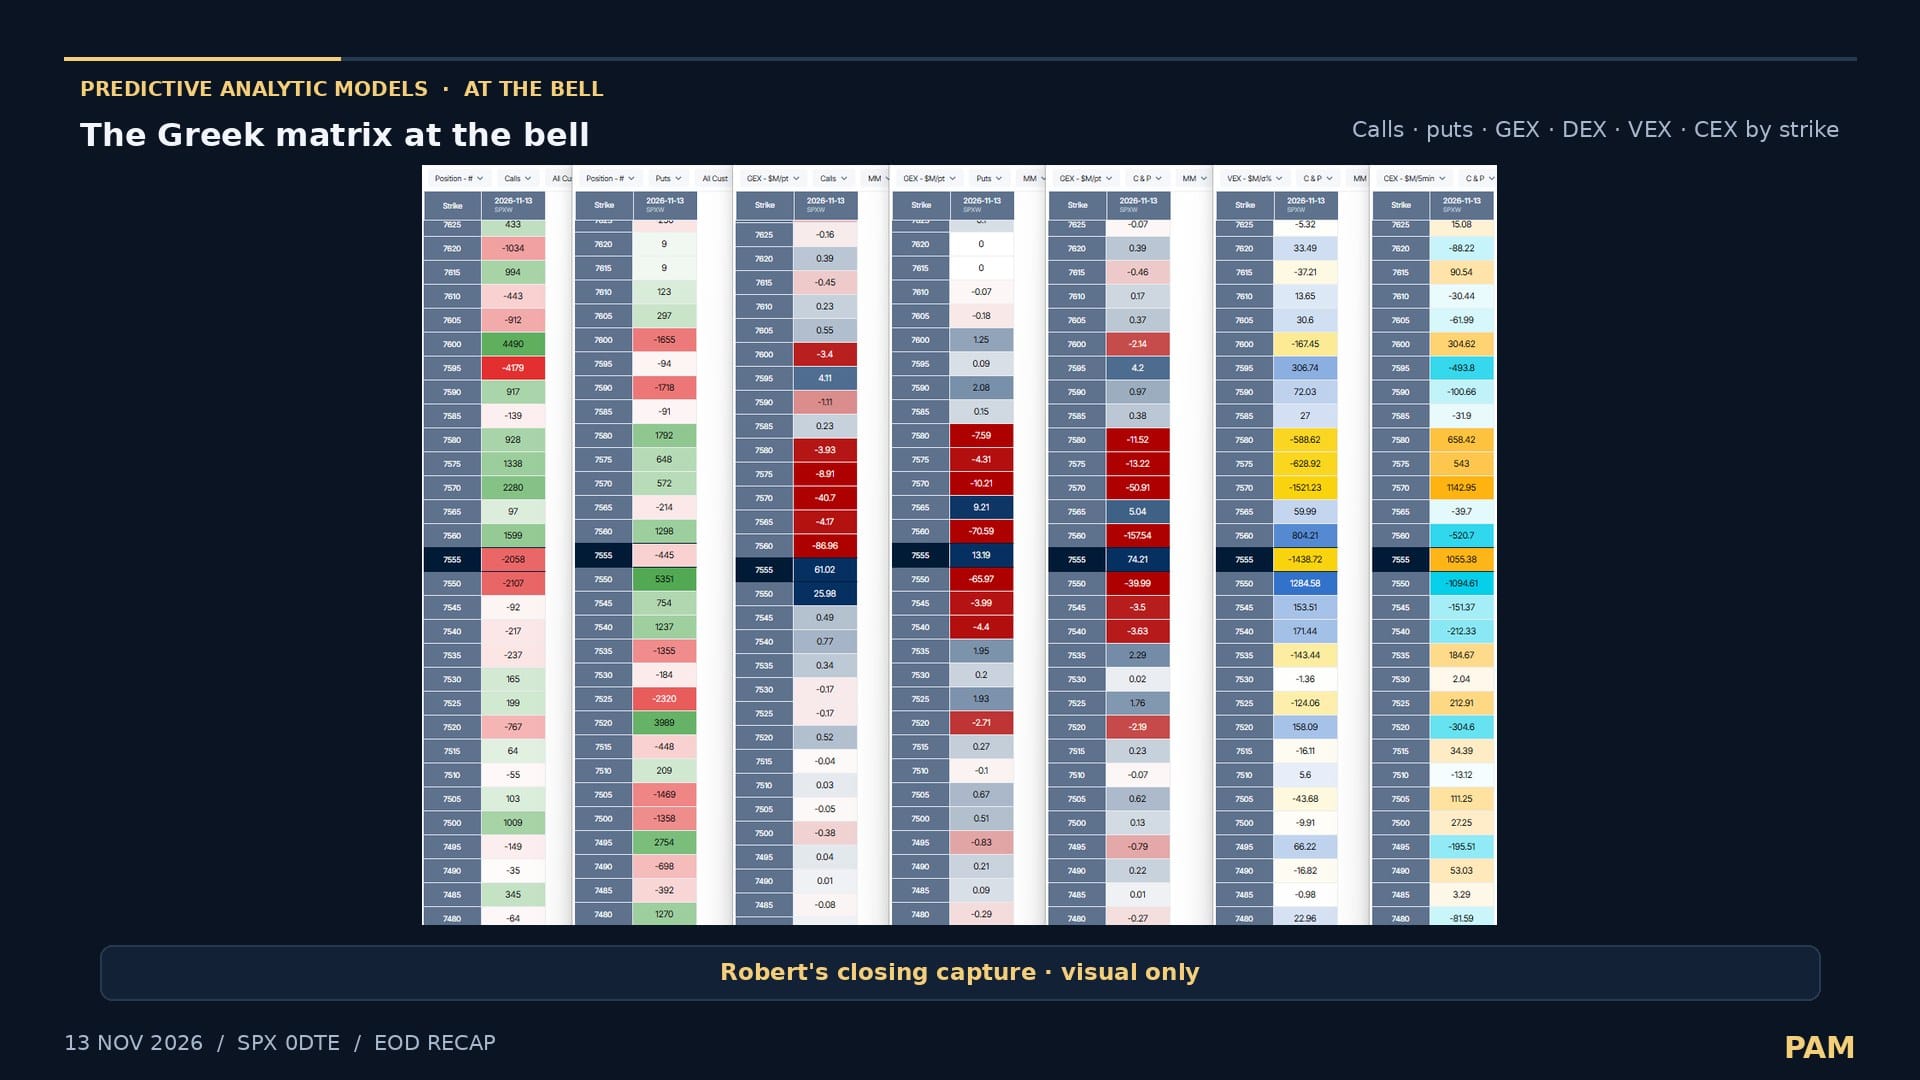
What you see: the last hour, minute by minute, with the final snapshot's levels drawn as dashed lines and the wall shaded. This is the scorecard: did price respect the book's levels into the close? Then come the closing flow picture and a full strike-by-strike table of positions and Greeks at the bell. In the table, read the sign of each value and how heavily the cell is shaded. We show these captures as visuals only, and the narrated numbers come from the data.
For price: when the close respects the book, the final holds and caps tend to be the next session's first references. A late flow surge that price doesn't follow is an open question, not a signal.
For price, the close itself: empirically, a large negative-GEX strike inside a thick negative-GEX zone often draws the end-of-day close. There is no single reason. Likely contributors are late-day hedging that chases price into the zone, and very heavy expiring open interest at those strikes: gamma there gets extreme in the last hour, so re-hedging keeps price circling. A third is charm and vanna unwinding concentrated at those strikes. On 13 Nov, 7560 was the deepest negative strike at 15:16 ET (−54.5), at the lower edge of the 7560–7575 negative zone. SPX closed at 7,561.67, 1.67 points above it.
Sometimes: the charm curve
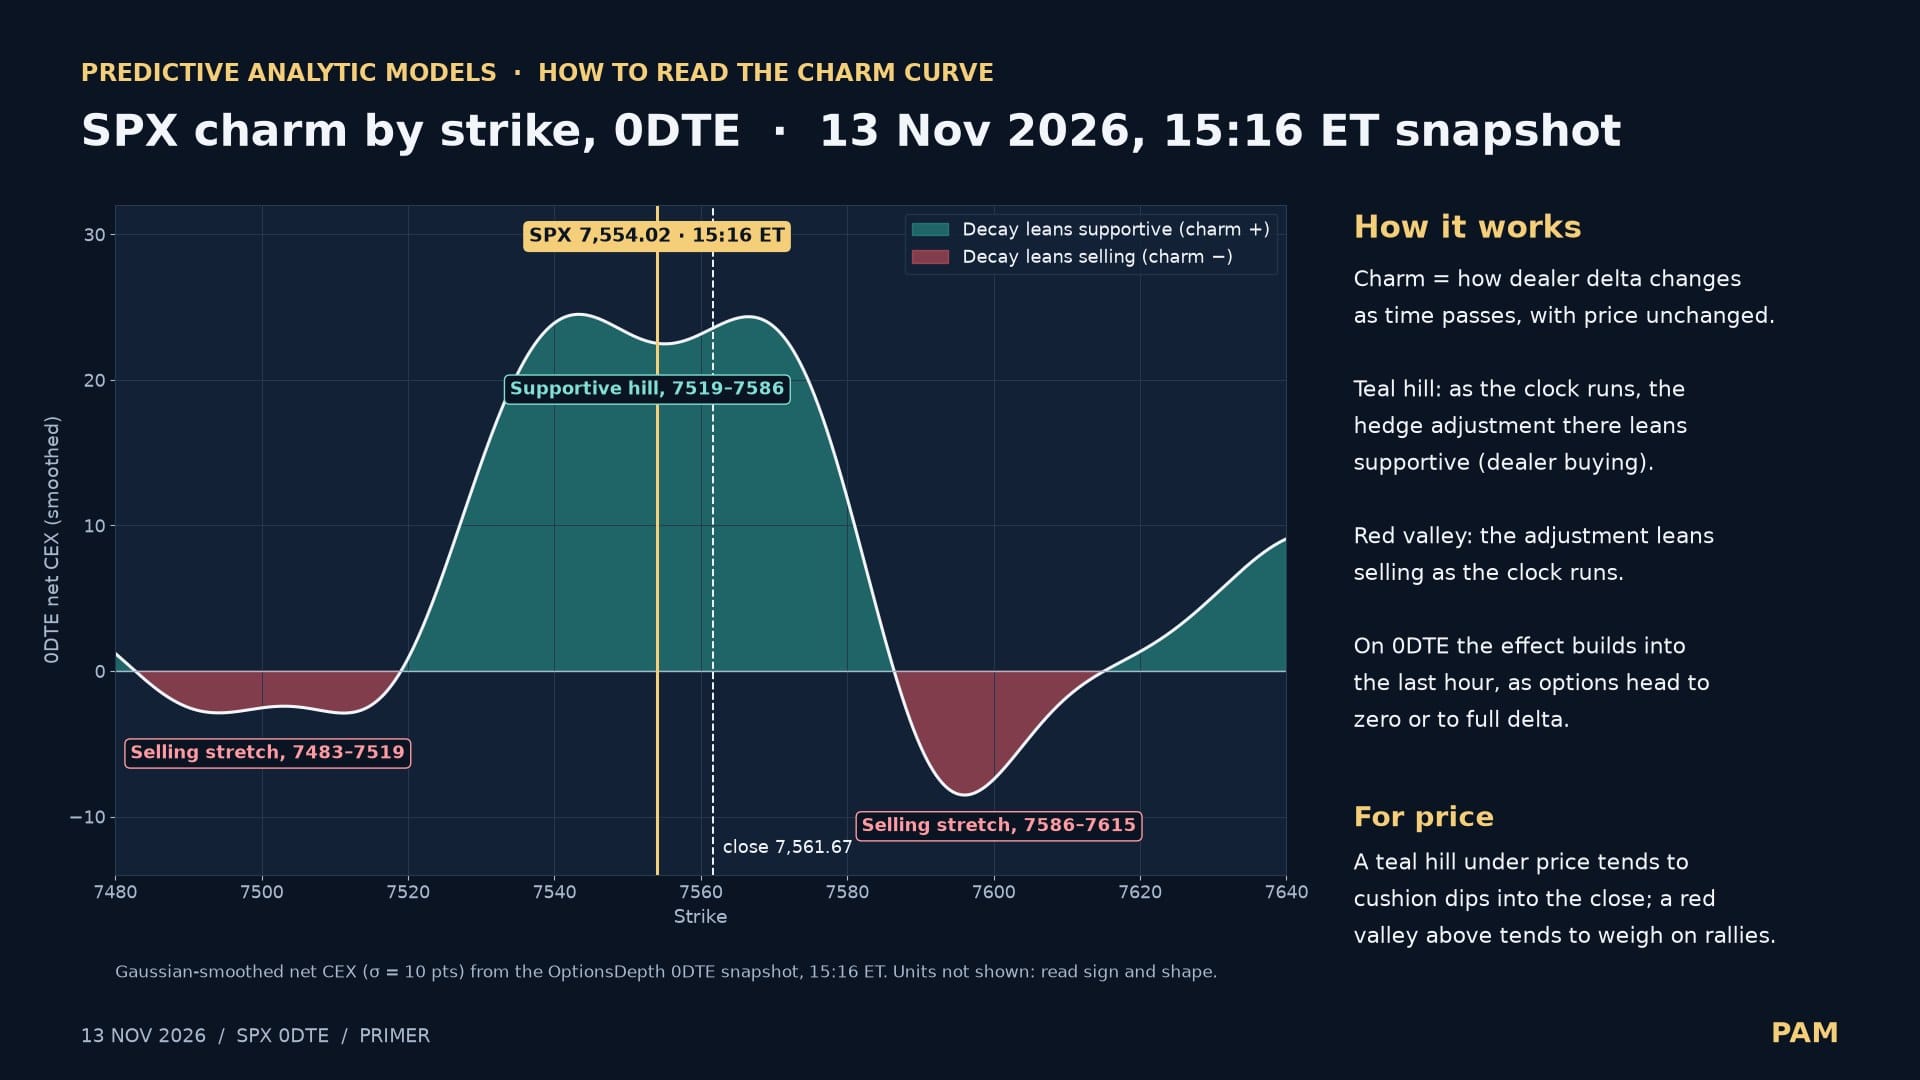
What you see: the charm row of the Queue Map, smoothed into one curve across strikes (a Gaussian blend with a 10-point width). Teal hills are stretches where charm is positive: as the clock runs, the hedge adjustment there leans supportive. Red valleys are stretches where charm is negative and the adjustment leans selling. A gold line marks price. On 0DTE the effect builds into the last hour, as the options head to zero or to full delta. How to use it: find which stretch price sits in, and what lies just above and below it.
For price: a teal hill under price tends to cushion dips into the close, and a red valley above tends to weigh on rallies. Price sitting inside a broad teal hill late in the day tends to drift and hold rather than break down. On 13 Nov at 15:16 ET, SPX (7,554.02) sat inside a supportive hill that ran from about 7519 to 7586, with a selling stretch above it from about 7586 to 7615. The 15:41 ET dip to 7,544.35 was cushioned inside the hill, and the late push faded below the red stretch, closing at 7,561.67.
Sometimes: the Game Plan check
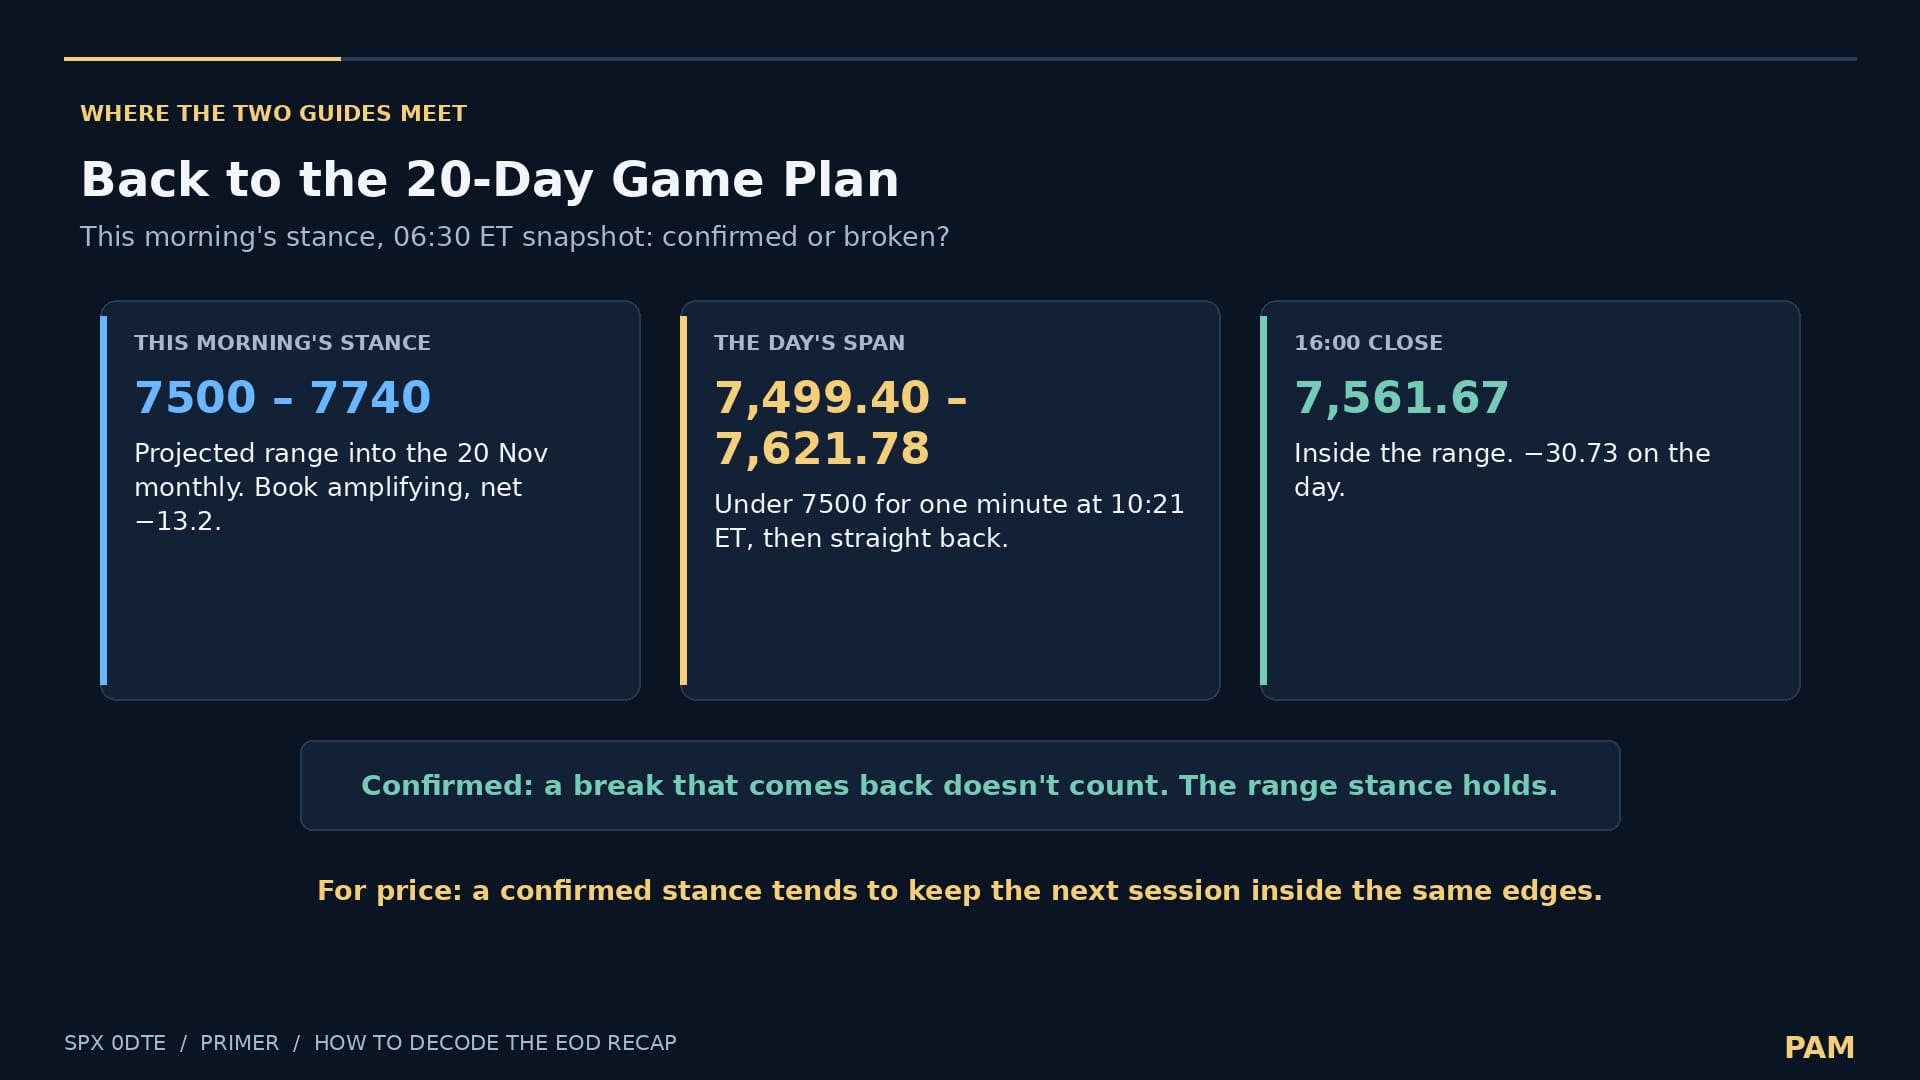
What you see: this morning's 20-Day Game Plan stance, the day's full span and the close, side by side, with a verdict: confirmed or broken. This is where the two manuals meet. The Game Plan sets the edges and the rules before the open (see our companion guide, "How to Read the S&P 500 20-Day Game Plan"), and the recap scores the day against them. How to use it: use the plan's own wording. "A break that does not come back" ends a range. A brief poke through an edge does not.
For price: a confirmed stance tends to keep the next session inside the same edges, with the plan's ceiling and weak spot as the first references. A broken stance tends to mean the next Game Plan redraws the map. On 13 Nov the stance was a projected range of 7500–7740. SPX ranged from 7,499.40 to 7,621.78, touching under 7500 for a single minute before it came straight back, and closed at 7,561.67. The stance was confirmed.
Worked example: Friday 13 November 2026
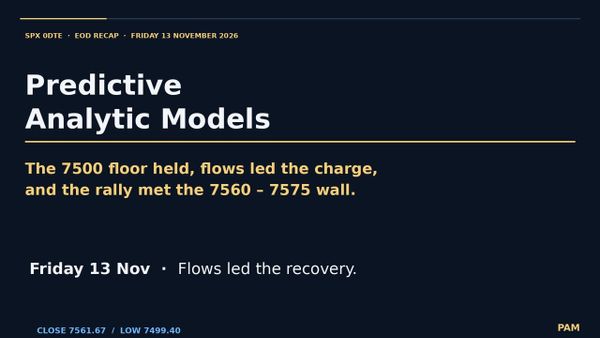
- The slide and the floor. Market-wide selling pushed SPX from a 7,616.85 open toward 7500. The 7500 hold grew from +2.8 at 10:00 ET to +13.8 by noon. Price touched 7,499.40 at 10:21 ET for one minute and bounced straight back, and a retest at 11:22 ET stopped at 7,504.99. Price read: the hold leaned against the slide.
- Support steps up. By 13:47 ET the biggest hold had moved up to 7545, at +31.9, with the print at 7,547.17. Price read: dips stayed shallow, and price ground higher.
- Flows lead. Just before 14:00 ET, market-wide Net Drift turned up and led the recovery, and SPX 0DTE calls surged. Price read: price followed the flows.
- The wall. At 14:00 ET, 7560–7575 had the deepest negative GEX, with negative vanna and positive charm, and the 7545 hold at +35.0 sat below as the backstop. Price read: rallies tend to slow there.
- The close. At 15:16 ET, 7555 was the strongest hold at +74.1, and 7560 a deep cap at −54.5, where customers had bought both calls and puts. 7545 was the only live strike. Price dipped to 7,544.35 at 15:41 ET, right on 7545 and inside the supportive charm hill, then ran to 7,568.33 at 15:51 ET inside the wall, and closed at 7,561.67, 1.67 points above 7560. Price read: the live hold caught the dip, the rally slowed in the wall, and the close settled by the deepest negative strike.
- The Game Plan check. The 7500–7740 range held. Price read: the same edges frame the next session until the book redraws them.
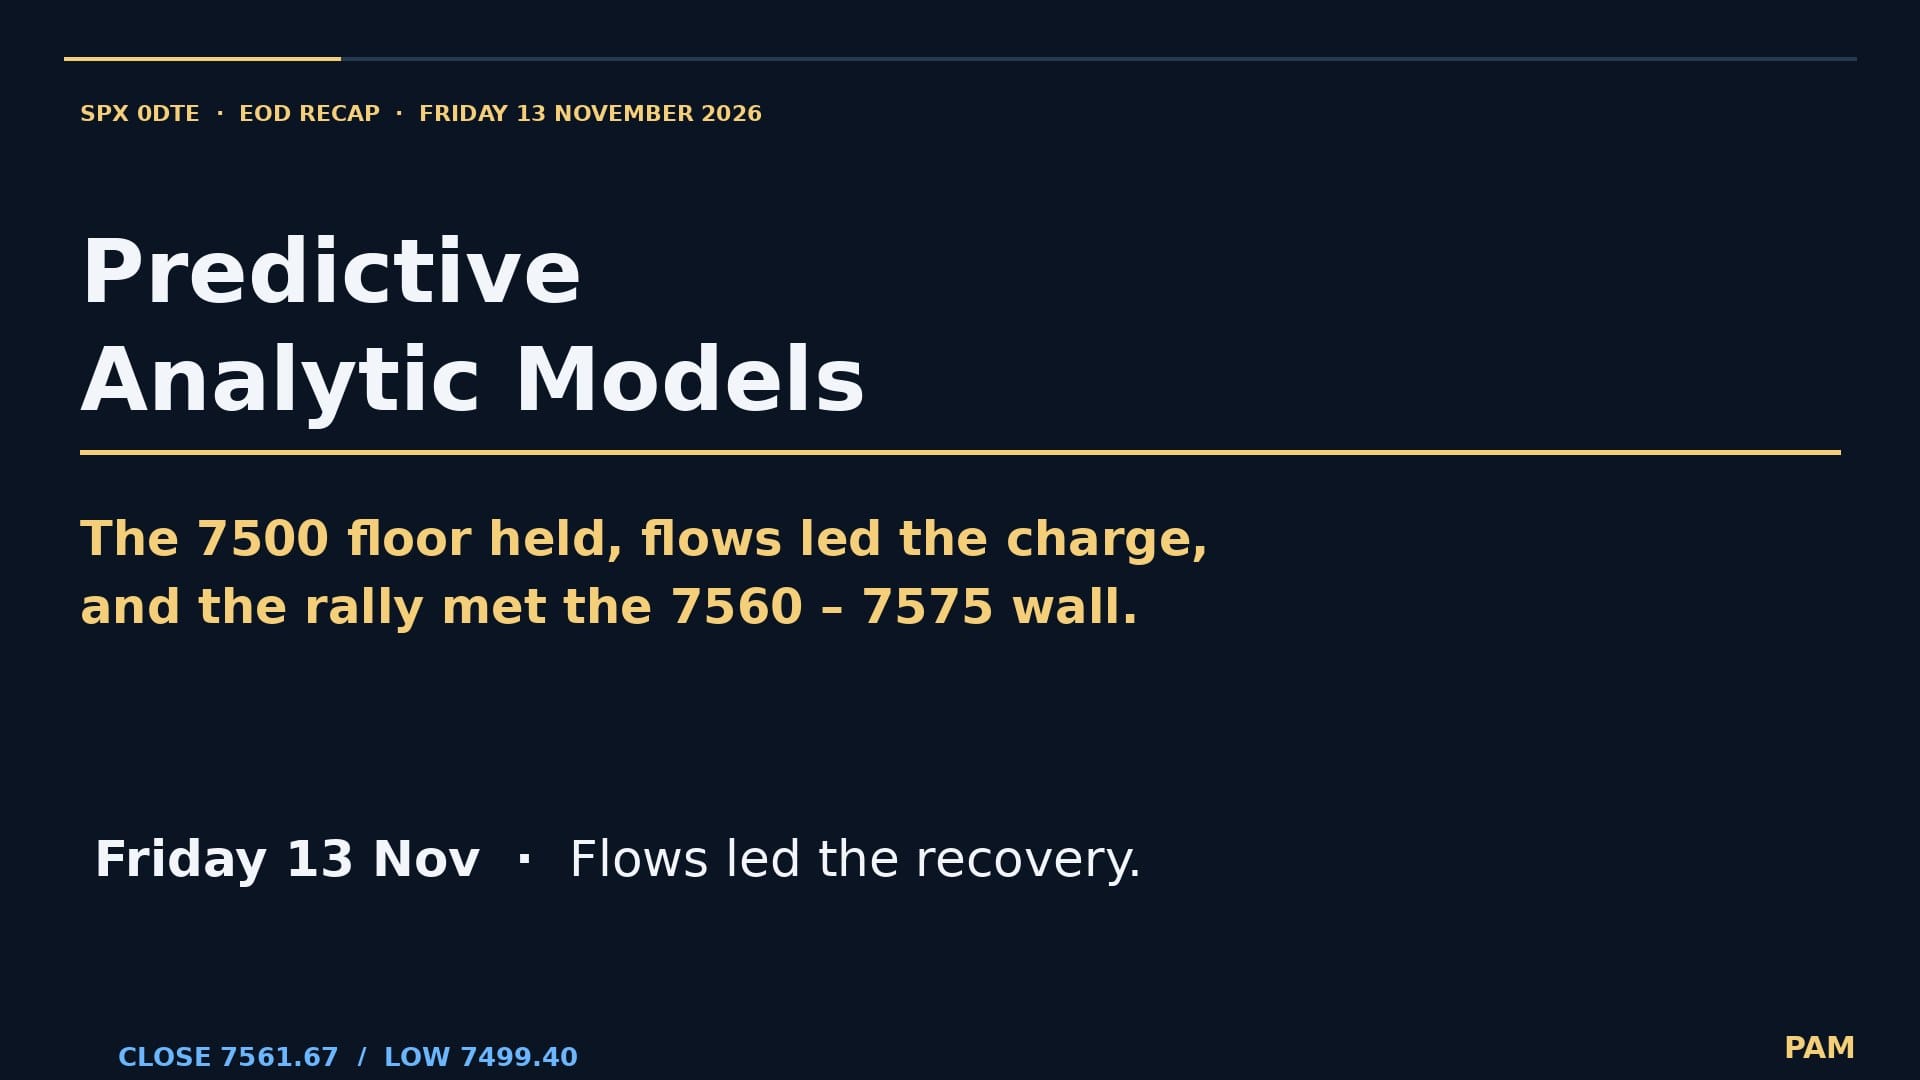
The lesson for the day: the flows led, the floor held, support stepped up behind price, and the rally met resistance inside the zone the book had flagged.
Your checklist
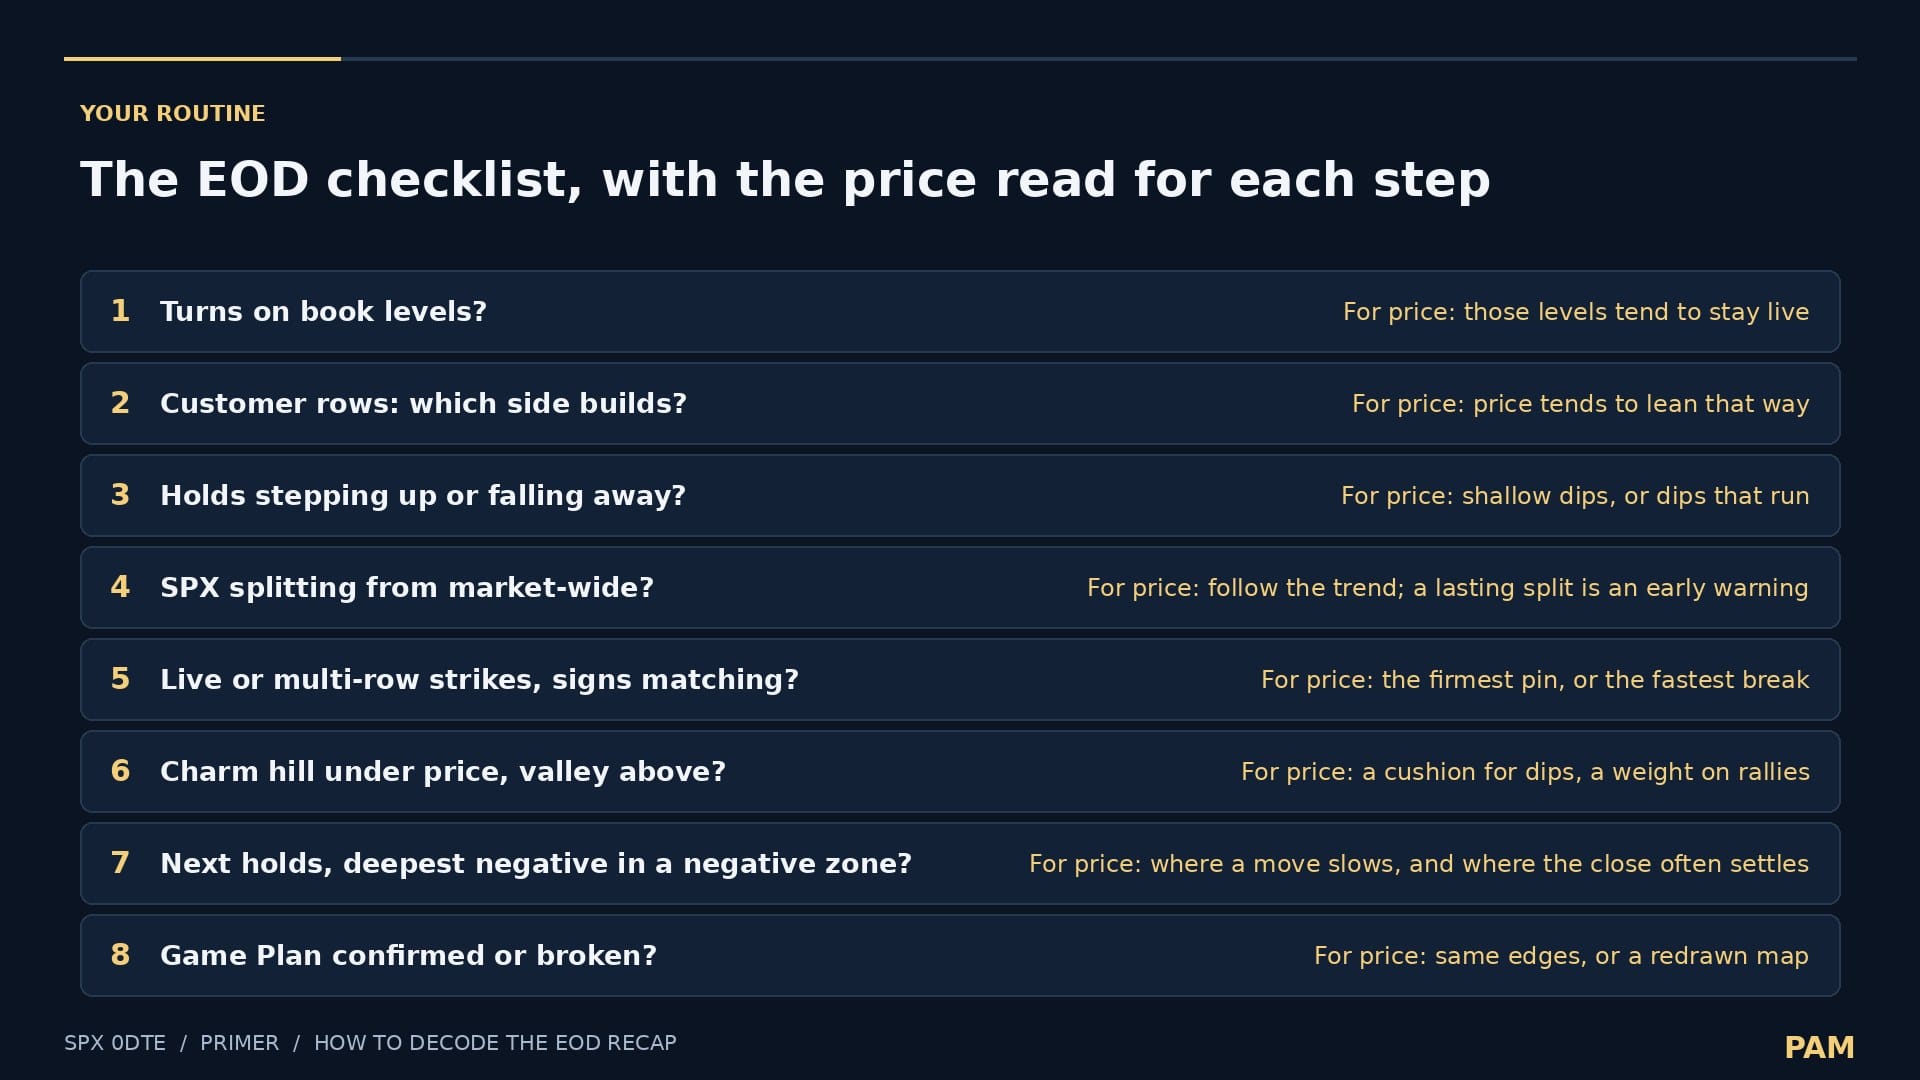
- Story and session: did the turns land on book levels? For price: those levels tend to stay live into the next session.
- Customer rows: which side are the flows building, and where did customers buy or sell both sides? For price: price tends to lean toward the side the flows build. Sold-both strikes tend to pin, and bought-both strikes tend to speed up breaks.
- Snapshots: are holds stepping up or falling away? For price: shallow dips, or dips that run.
- Net Drift: what's the market-wide trend, and is SPX splitting from it? For price: follow the trend, and treat a lasting split as an early warning of a turn.
- Queue Map: which strikes are live, or strong in several rows, and do the GEX and VEX signs match? For price: the firmest pin, or the fastest break.
- Charm curve: is price sitting in a teal hill or under a red valley? For price: a cushion for dips, or a weight on rallies, into the close.
- Next holds and the close: where are the next holds, and the largest negative strike in a negative zone? For price: where a move most likely slows, and where the close often settles.
- Game Plan check: confirmed or broken? For price: the same edges, or a redrawn map, for the next session.
New positioning can redraw the map at any time. Treat every level as a reference point, not a promise.
Appendix: DEX, for special situations
DEX (delta exposure) is the market makers' net directional exposure per strike, the bottom Queue Map panel. It adds little on most days, except in three situations:
- Large DEX concentrated at a strike near the 0DTE close. Those hedges unwind as the options head to zero or to full delta. For price: price can move sharply around that strike late in the day.
- DEX leaning the opposite way to the customer flows. The hedges are lagging the flow. For price: price tends to catch up toward the flow side.
- Heavy DEX at a level where negative GEX breaks. The hedge adjustment adds fuel. For price: the move tends to run further.
Get the daily recap, the Game Plan and the advisories by email, free: Subscribe at Predictive Analytic Models
Educational only.