How to Read the S&P 500 20-Day Game Plan: Options Stance, GEX Map, OpEx and the 0DTE Queue Map
How to read the Predictive Analytic Models pre-market Game Plan, plate by plate, and what each reading tends to mean for price, with a worked example from Friday 13 November 2026.
Every trading morning before the US open, we publish the 20-Day Game Plan for the S&P 500 index (ticker SPX) and its options. It reads the live options book out to the next monthly options expiration (OpEx), and turns it into a stance, a map and the conditions that would confirm or break it. This guide walks through its plates in film order, and what each one says about where price tends to go next. Every section ends with a For price: read. Each one is a tendency, not a call.
This is Guide 2 of 2. Guide 1, How to Read the S&P 500 0DTE EOD Recap (watch the film), covers the evening recap that scores each Game Plan. The two are built to be read together: the Game Plan sets the edges and the rules before the open, and the recap checks the day against them. The first three sections below (the vocabulary, vanna and charm, and the customer rows) are shared with Guide 1, so if you have read it you can skim them.
What "20-Day" means
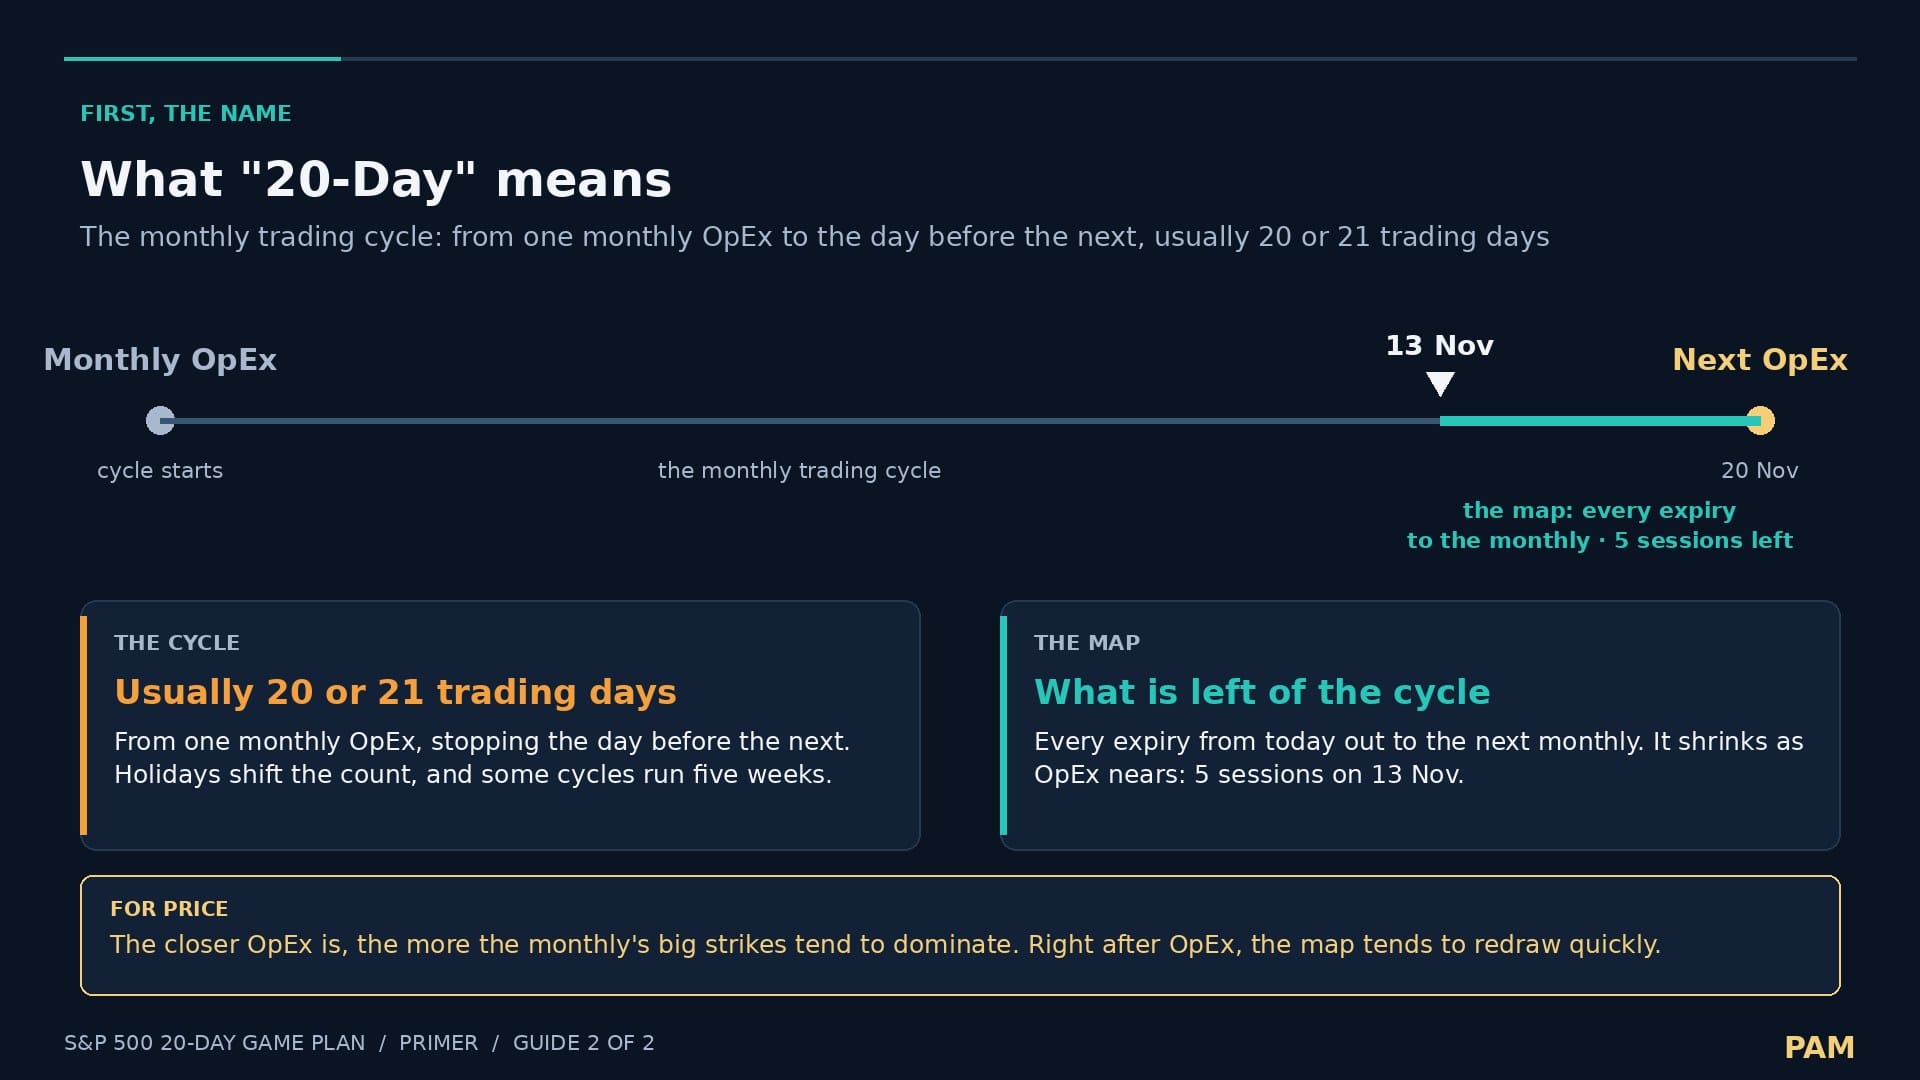
"20-Day" refers to the monthly trading cycle. A cycle runs from one monthly OpEx (the third Friday) and stops the day before the next one: usually 20 or 21 trading days, depending on holidays (some cycles run five weeks). The Game Plan reads the positioning for what is left of the current cycle, so the map covers every expiry from today out to the next monthly, and it shrinks as OpEx nears: on 13 November, 5 sessions were left before the 20 November monthly.
For price: the closer OpEx is, the more the monthly book's big strikes tend to dominate, and the more weight its edges carry. Right after OpEx, a large part of the book has expired, so the map tends to redraw quickly over the first few sessions of a new cycle.
The vocabulary
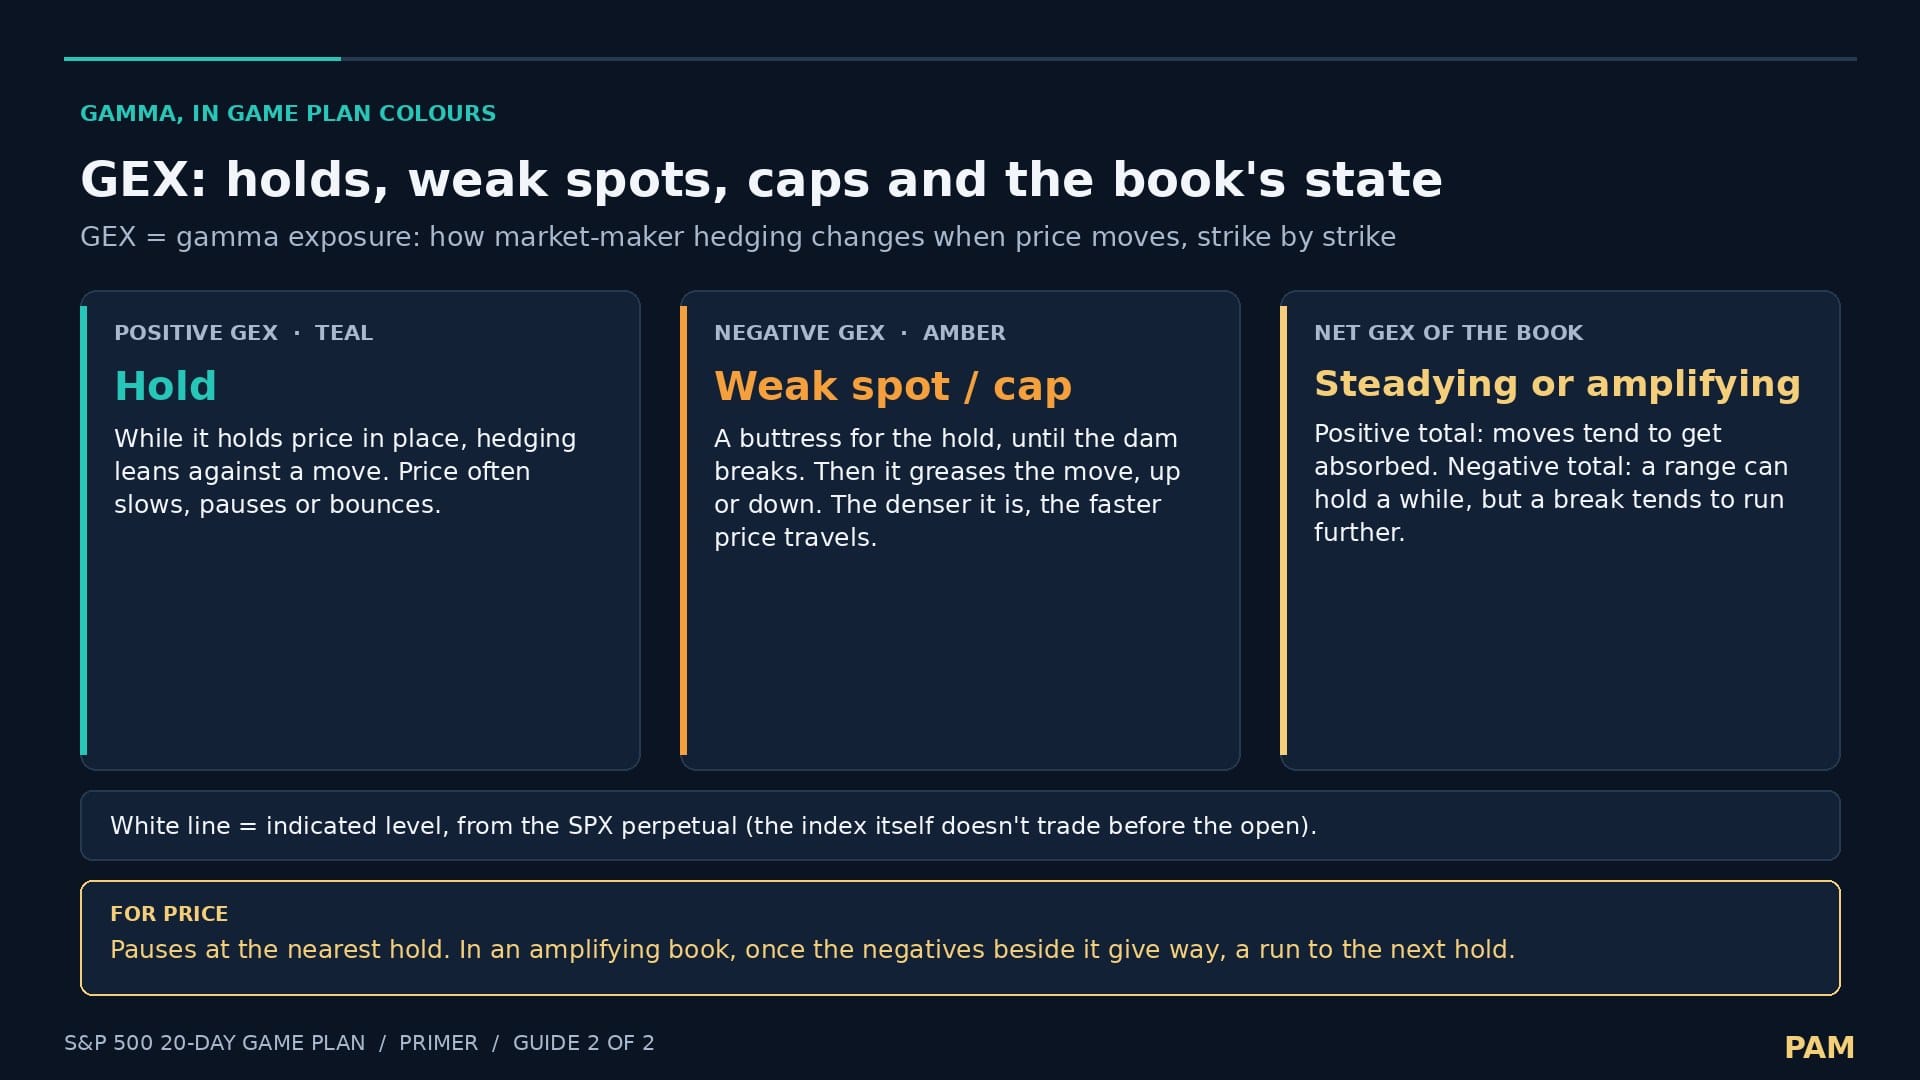
- GEX (gamma exposure) is how much market makers have to buy or sell as price moves, strike by strike, in $ million per point. We show it for the market makers' side of the book.
- Hold is a strike with positive GEX. While it holds price in place, market-maker hedging there leans against moves, so price often slows, pauses or bounces at a hold. On the Game Plan, holds are teal.
- Weak spot (below price) or cap (above price) is a strike with negative GEX. At first, negative GEX works like a buttress for the nearby hold and helps keep price contained. That lasts until the dam breaks. Once price pushes through, the negative GEX does the opposite: it greases the move, up or down, and the denser the negative GEX, the faster price tends to travel through it. On the Game Plan, negative strikes are amber/orange.
- Ceiling is the largest hold above price over the window.
- Steadying vs amplifying: add up the net GEX of a book. A positive total is steadying: the holds carry more weight, and moves tend to get absorbed. A negative total is amplifying: the buttresses carry more weight, so a range can hold for a while, but once a level gives way, the move can run further and faster, in either direction.
- Indicated level is the pre-market price from the SPX perpetual, the white line on every chart. It isn't the index itself, which doesn't trade before the open.
For price: price tends to pause or bounce at the nearest hold, and a steadying book tends to keep moves contained. In an amplifying book, a level can hold for a while, but once the negative GEX next to it gives way, the move tends to run quickly to the next hold, and the denser the negative strikes in between, the faster.
How VEX and charm stack on top of GEX
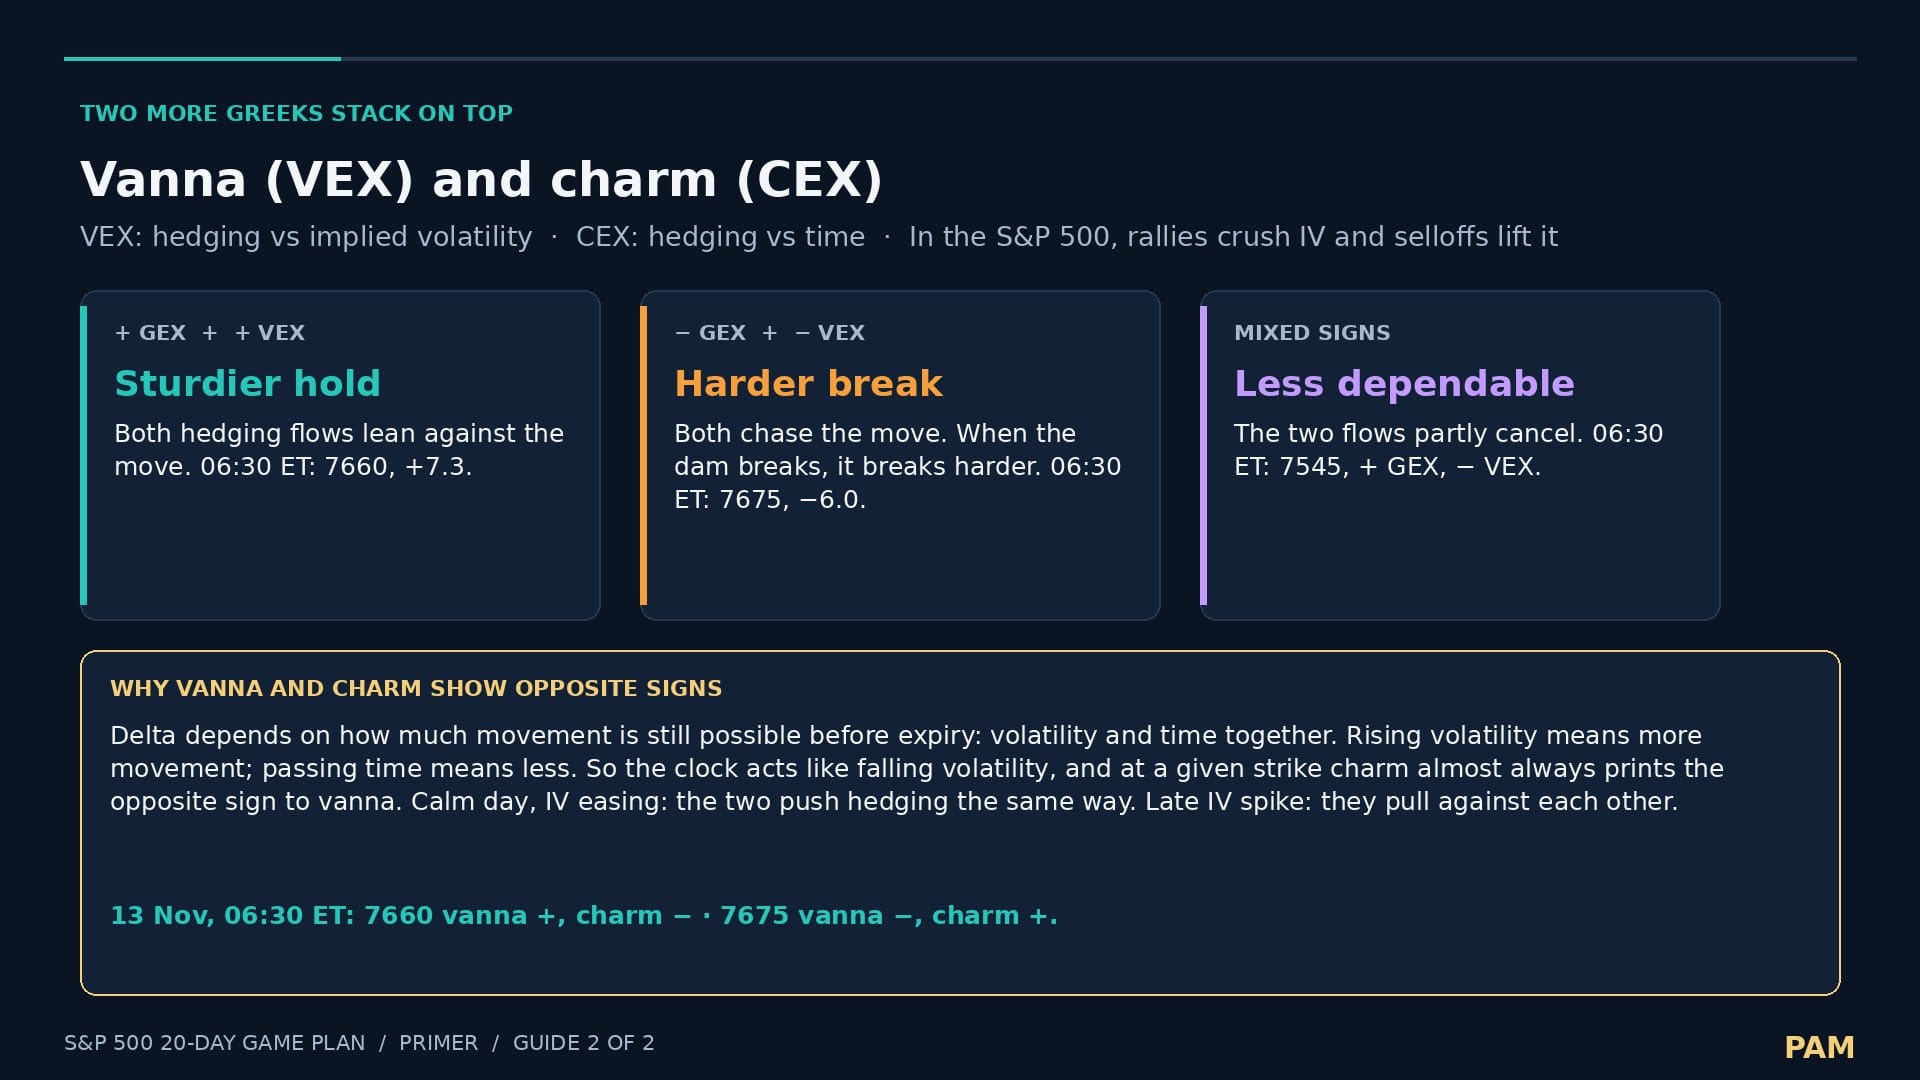
GEX tells you how market-maker hedging changes when price moves. VEX (vanna exposure) tells you how that hedging changes when implied volatility (IV) moves. In the S&P 500 the two usually move in opposite directions: rallies tend to crush IV, and selloffs tend to lift it. So a single price move usually triggers both kinds of hedging at once, and the signs at a strike tell you whether they work together:
- Positive GEX + positive VEX: both hedging flows lean against the move. That makes for a sturdier hold.
- Negative GEX + negative VEX: both hedging flows chase the move. When the dam breaks, it breaks harder, and the move tends to run further.
- Mixed signs: the two flows partly cancel each other, so the level is less dependable.
Charm (CEX) is how delta changes as time passes. On 0DTE options, time is short, so the charm unwinding builds into the close. Over a multi-day map it works more slowly, but it still adds up, and it speeds up into each expiry.
These are tendencies, not guarantees. Each recap shows how they actually worked that day.
Why VEX and charm show opposite signs
An option's delta depends on how much movement is still possible before it expires, and that comes from volatility and time together. VEX measures how delta changes when volatility rises, which means more possible movement. Charm measures how delta changes as time passes, which means less possible movement. So the clock running down acts like a drop in volatility. Both pull the same lever, in opposite directions, so at a given strike charm almost always prints the opposite sign to VEX.
Practical read: on a calm day, with IV drifting lower and the clock running, the vanna and charm flows push dealer hedging the same way. They pull against each other when IV rises late in the day, for example during a selloff that bids up volatility.
Caveat: the relationship is exact in the standard option-pricing model and holds almost always in practice. Very short-dated, far out-of-the-money strikes can occasionally bend it.
On the 13 November 06:30 ET Queue Map, both cases sat side by side. 7660 had positive GEX (+7.3, the largest 0DTE hold) with positive VEX and negative charm. 7675 had negative GEX (−6.0, the largest 0DTE negative) with negative VEX and positive charm.
What it means for price
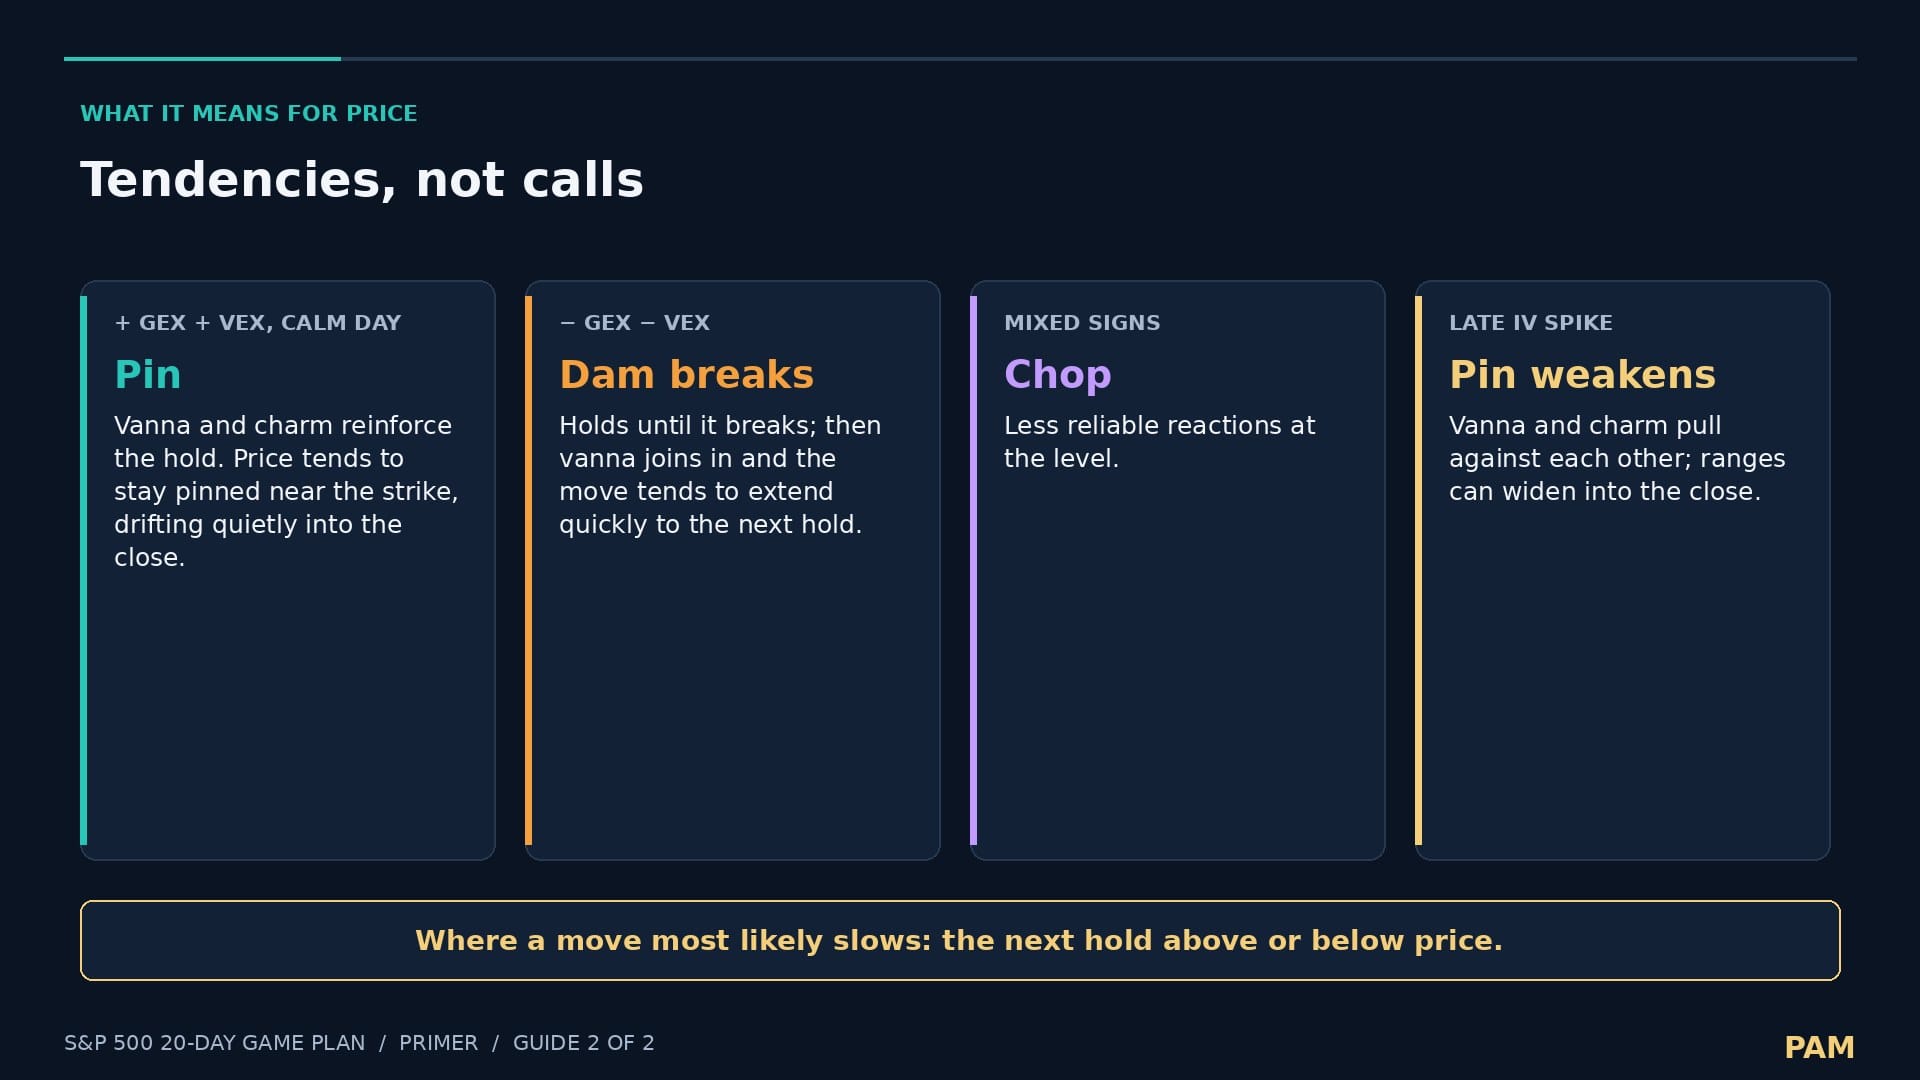
These are tendencies, not calls. They describe how hedging flows often shape price behaviour around a strike.
- Positive GEX + positive VEX at a strike near price, on a calm day. IV is easing and the clock is running, so the vanna and charm flows reinforce the hold. Price tends to stay pinned near that strike, with a quiet drift into the close.
- Negative GEX + negative VEX. The level holds until the dam breaks. Once it breaks on the downside, rising IV adds vanna selling to the hedging. On an upside break, falling IV adds vanna buying instead. Either way, the move tends to extend quickly toward the next positive-GEX hold.
- Mixed signs. Expect chop, and less reliable reactions at the level.
- A late-day IV spike while time runs out. Vanna and charm pull against each other, so afternoon pin behaviour weakens and ranges can widen into the close.
Where a move most likely slows: look for the next hold above or below price, the next strike with positive GEX. Those are the levels each Game Plan and recap names.
For price: when the signs match, a level tends to be more decisive, either a firmer pin or a faster break. When they're mixed, reactions tend to be noisier and shorter-lived.
Customer calls and puts: where customers are positioned
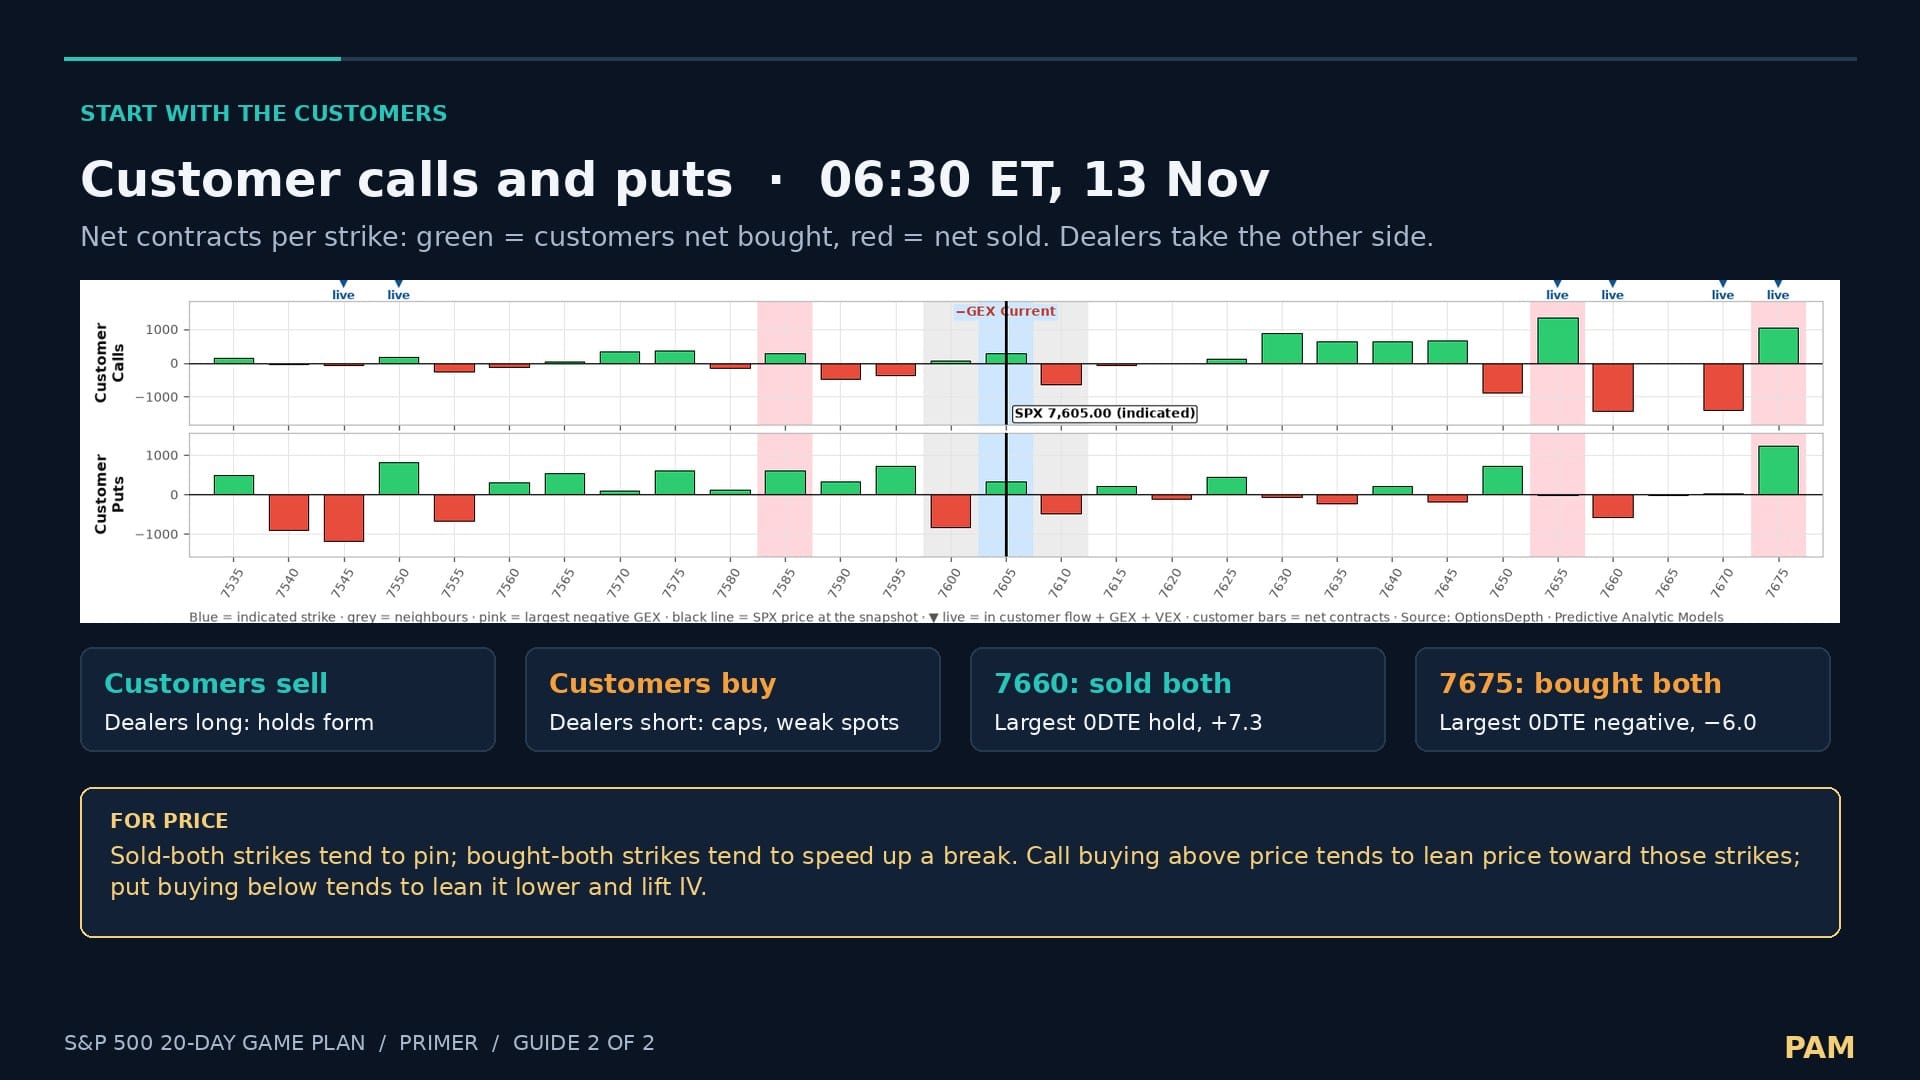
The top two Queue Map panels show net customer contracts at each strike, calls in one row and puts in the other. Green means customers are net buyers there, and red means they are net sellers. Market makers sit on the other side of those trades. Where customers buy options, dealers end up short them, which is usually where negative GEX comes from. Where customers sell, dealers end up long, which builds positive-GEX holds.
- Call buying above price, put selling below: customers leaning bullish.
- Put buying below price, call selling above: customers leaning bearish, or hedging.
- Distance from price: concentrations near the print matter most. Across snapshots, watch whether the bought strikes migrate toward price or away from it.
- Before the open: these bars show how customers carried positions into the session, including anything added overnight. The Game Plan reads them at 06:30 ET, so they are a starting position, not the day's final word.
For price: strikes where customers sold both calls and puts tend to become holds that pin price. Strikes where they bought both tend to become caps or weak spots, where a break speeds up. Call buying building above price tends to lean price toward those strikes, and put buying building below tends to lean it lower and lift IV, which adds vanna pressure. When the customer bars and Net Drift agree, price tends to follow. At 06:30 ET on 13 November, customers had sold both sides at 7660 (1,430 calls and 584 puts), the largest 0DTE hold at +7.3, and bought both at 7675 (1,039 calls and 1,223 puts), the largest 0DTE negative at −6.0. Below price, they had sold 1,189 puts at 7545, a hold at +3.5.
Plate 1. Starting conditions
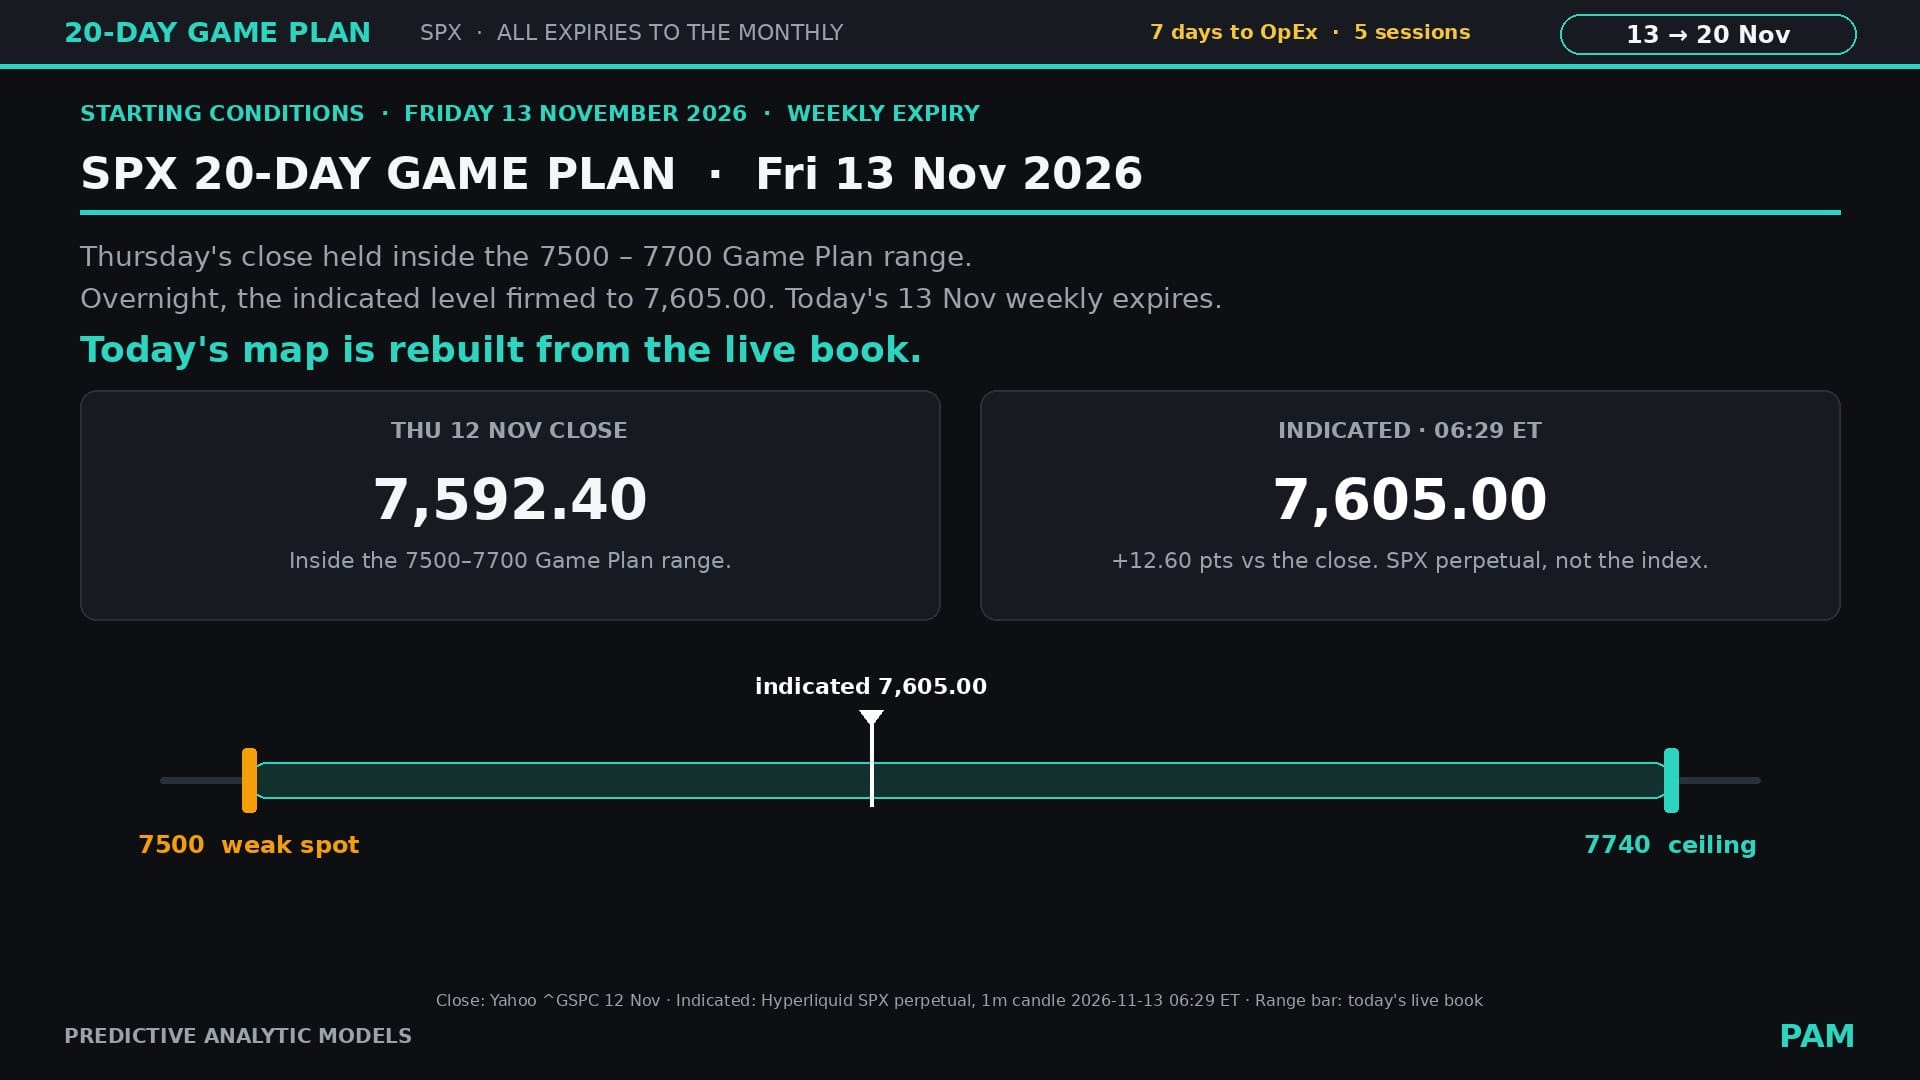
What you see: the prior close, the indicated level, and a range bar from the weak spot to the ceiling with the indicated level marked on it.
How to use it: note where the start sits inside the range: near an edge, or in the middle.
For price: a start near an edge tends to bring an early test of that edge. A mid-range start tends to leave room both ways, so the first move after the open is usually set by the 0DTE book (Plate 7) rather than by the edges.
Plate 2. The tactical stance
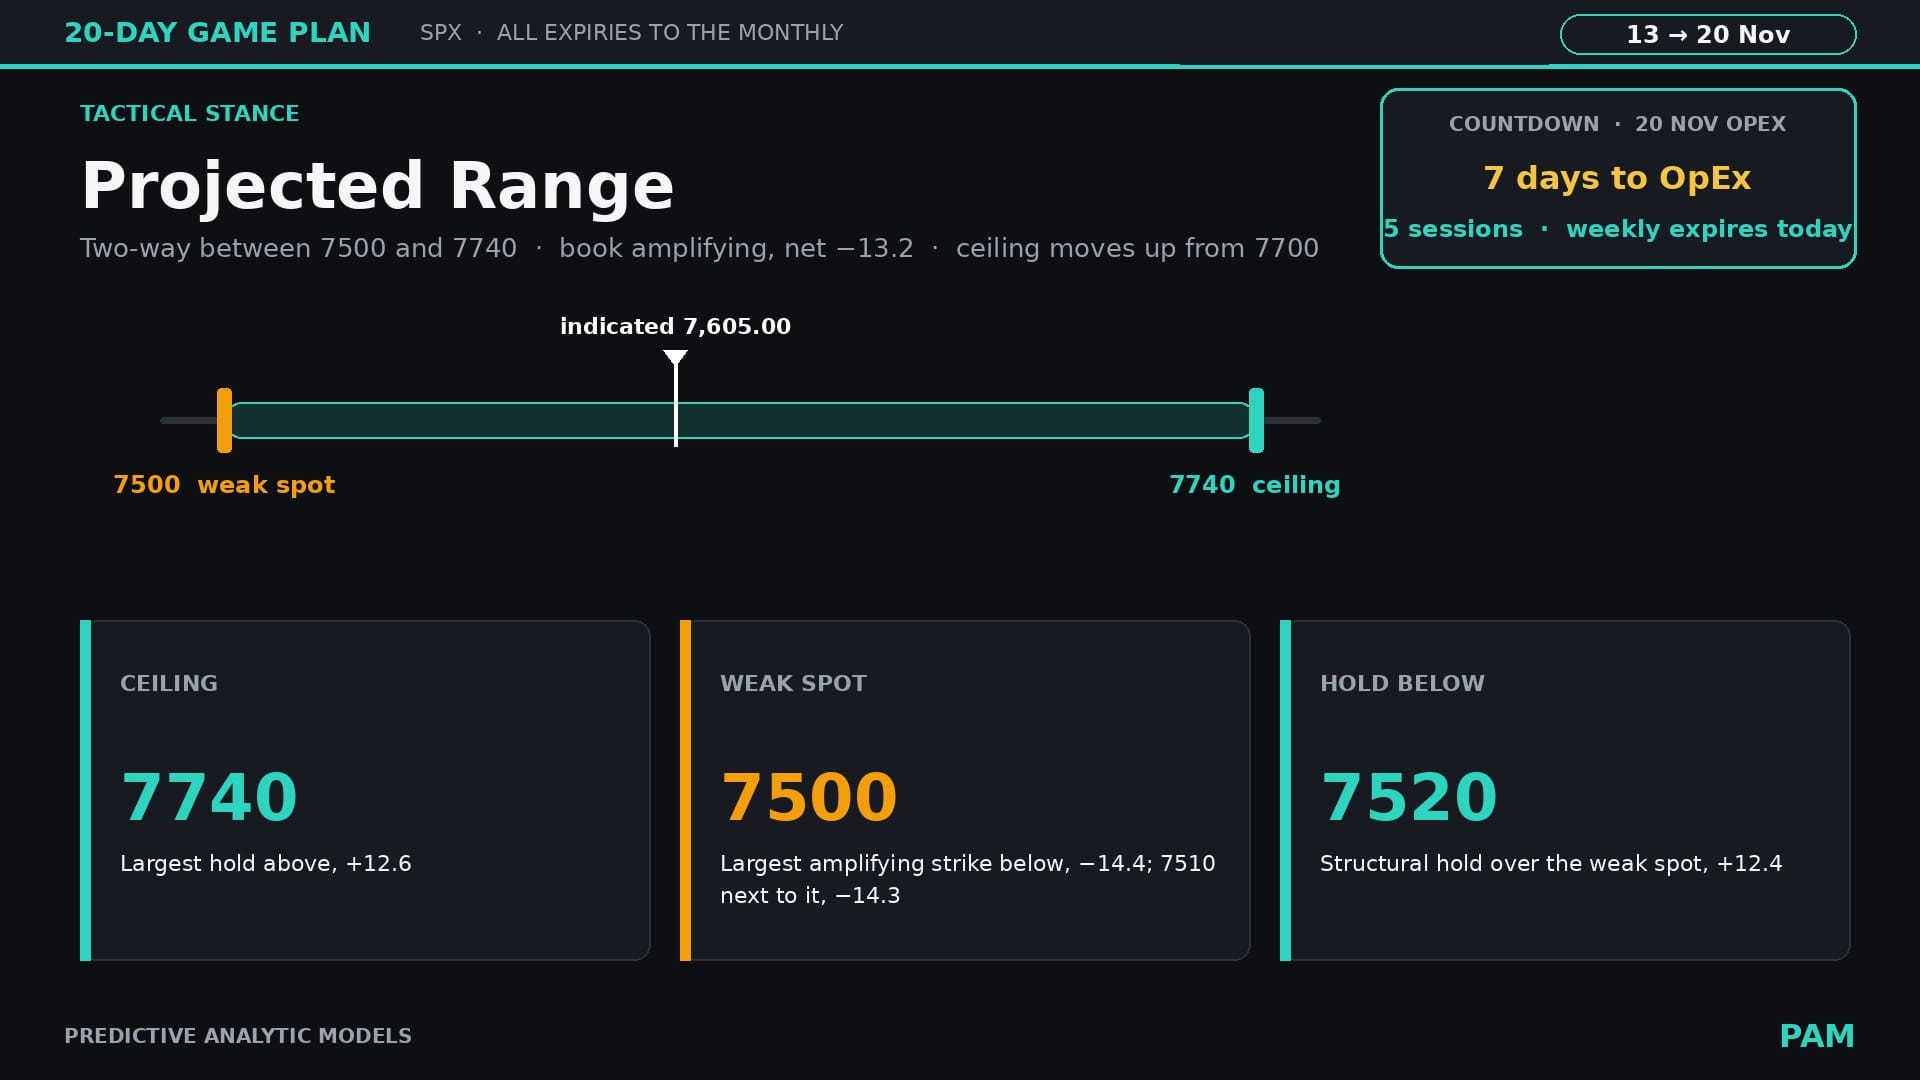
What you see: the stance name, for example "Projected Range", with cards for the ceiling, the weak spot and the hold above it, the book's net GEX and state, and a countdown to OpEx in calendar days and sessions.
How to use it: the stance is the plan's one-line summary. Read the three levels as the edges and the cushion, and the book state as how hard a break would run.
For price: under a Projected Range, price tends to rotate between the edges, with rallies slowing near the ceiling and dips cushioned at the hold above the weak spot. In an amplifying book, a clean break of an edge tends to run further than in a steadying one. The stance changes only when the confirm-or-break conditions (Plate 9) say so.
Plate 3. The 20-day map
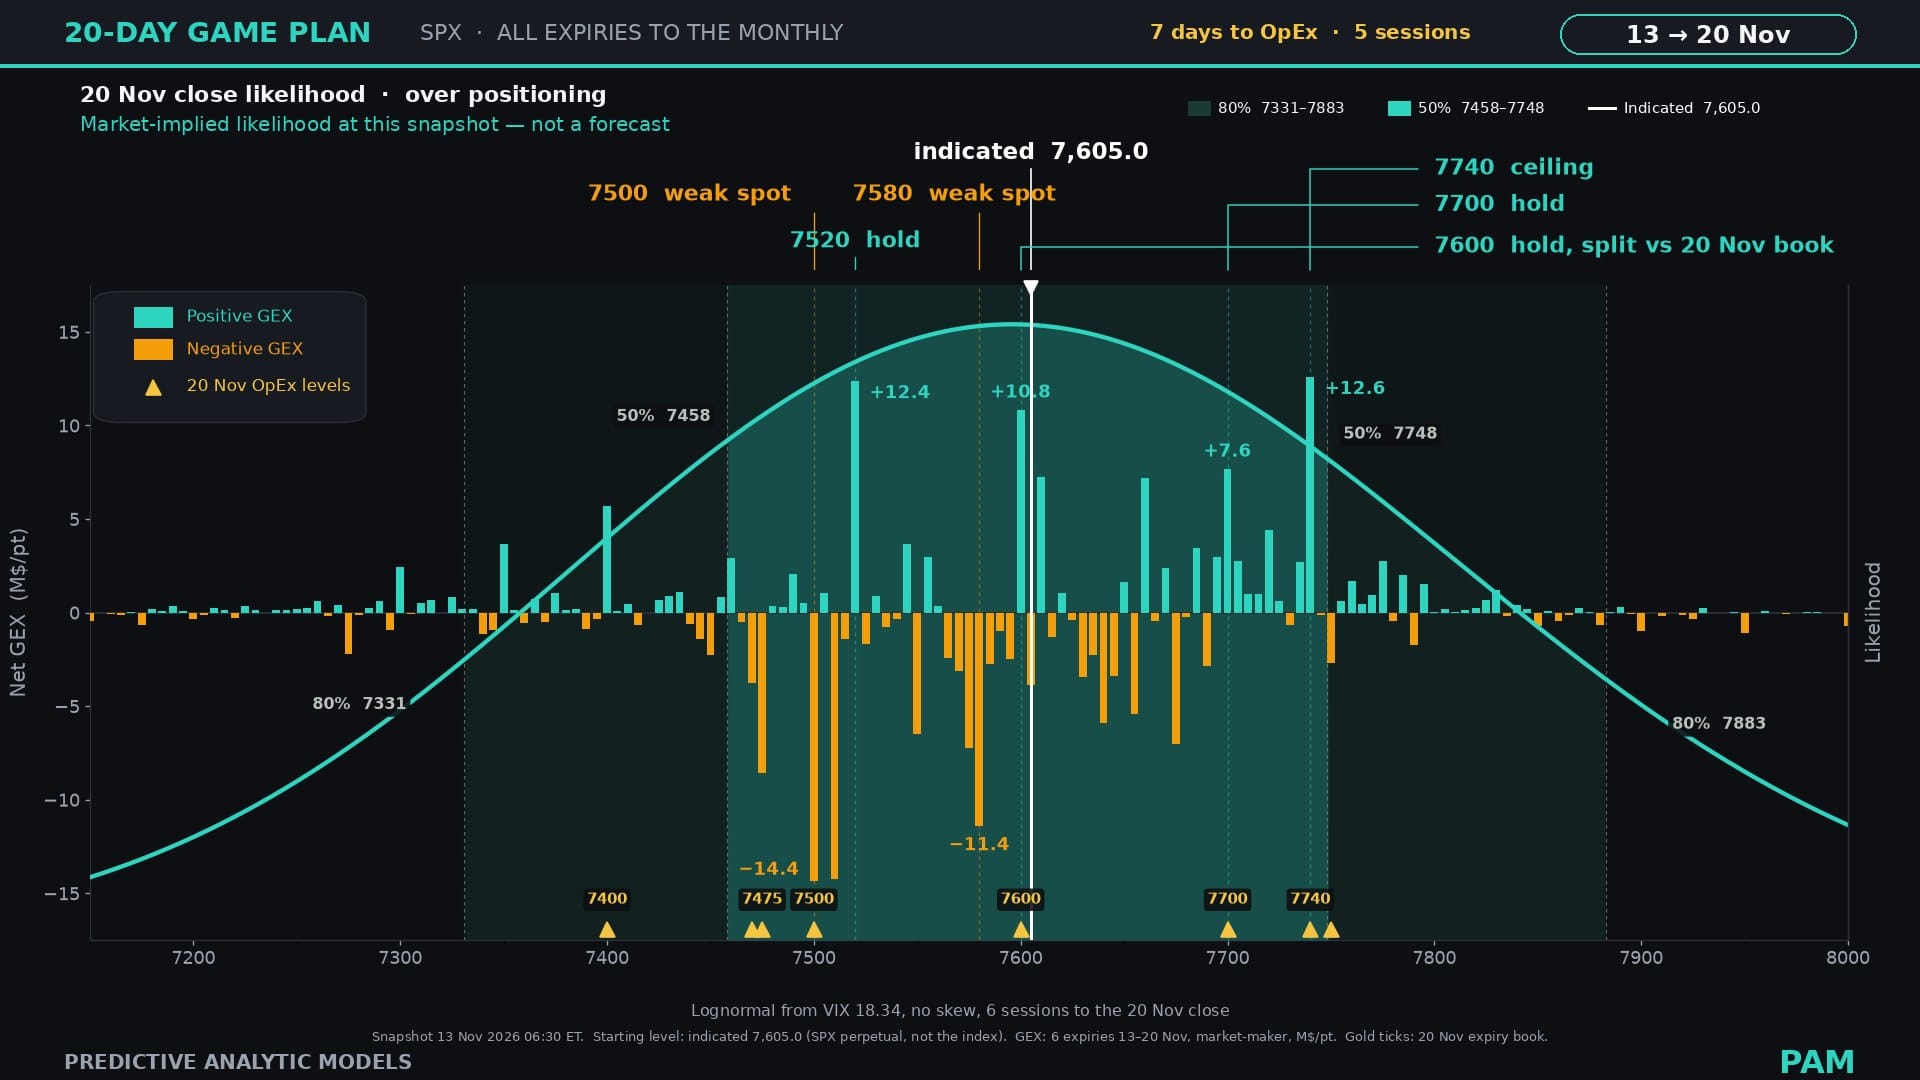
What you see: net GEX by strike across every expiry out to the monthly, with teal holds and orange negatives. Gold triangles mark the monthly OpEx levels. The curve is the market-implied likelihood of the OpEx close: a lognormal sketch from the VIX, with no skew, centred on the indicated level, with 50% and 80% bands shaded. It is not a forecast, and it reshapes as positioning changes. The labels name the ceiling, the holds and the weak spots.
How to use it: compare the bands with the bars. Find the biggest teal bars near the edges of the 50% band, and the orange clusters just beyond them.
For price: big teal bars at the edges of the 50% band tend to be where the range turns. Large orange clusters just beyond an edge tend to be where a break would accelerate, because that is where the dam breaks and the negative GEX greases the move. Inside the band, a thick orange stretch between two holds tends to mean price crosses it quickly rather than settling in it.
Plate 4. Monthly OpEx book vs the combined window
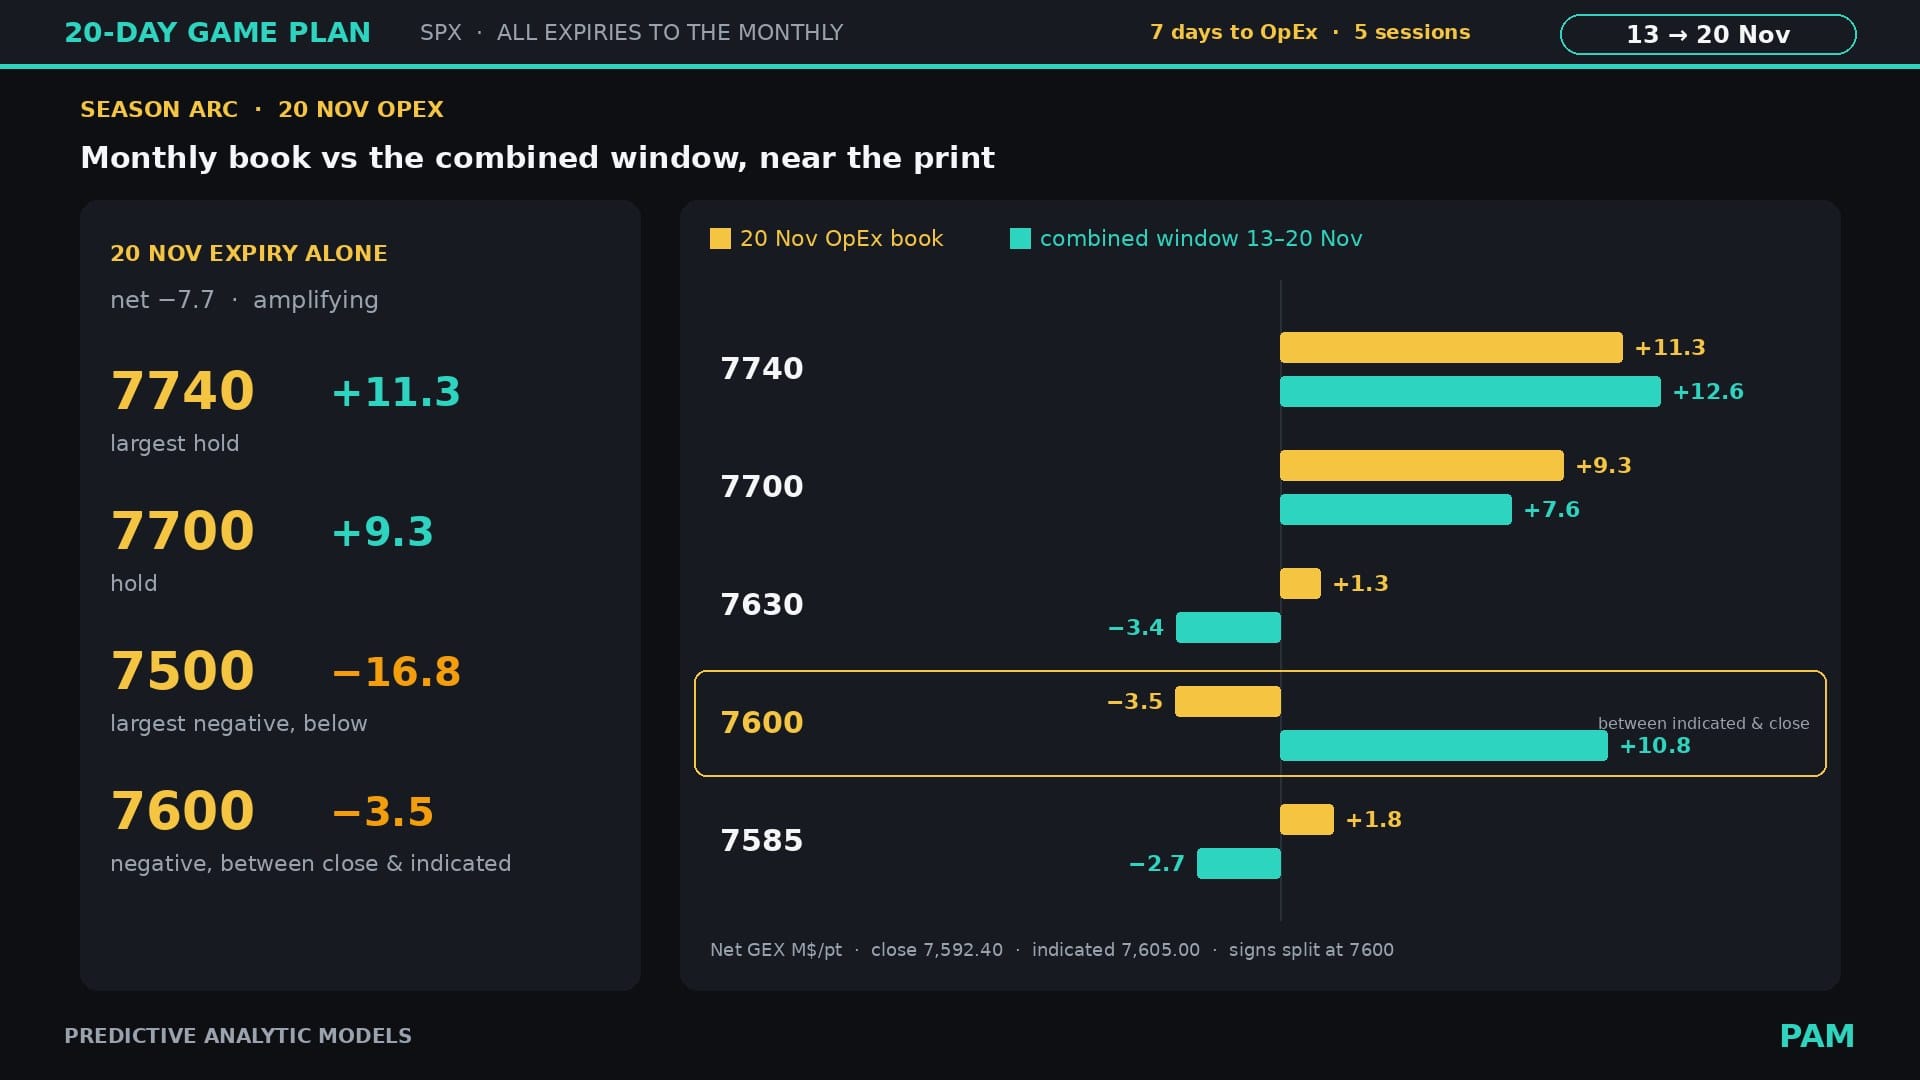
What you see: gold bars for the monthly expiry alone, teal for all expiries combined, strike by strike, with a note where the two disagree in sign.
How to use it: check the edges first: do both books agree on the ceiling and the weak spot? Then look for splits near the print.
For price: where both books agree, the level tends to be sturdy. Where they split, price tends to chop around that strike rather than respect it cleanly. As OpEx nears, the monthly book tends to take over, so a split usually resolves its way.
Plate 5. The week ahead: the next three expiries
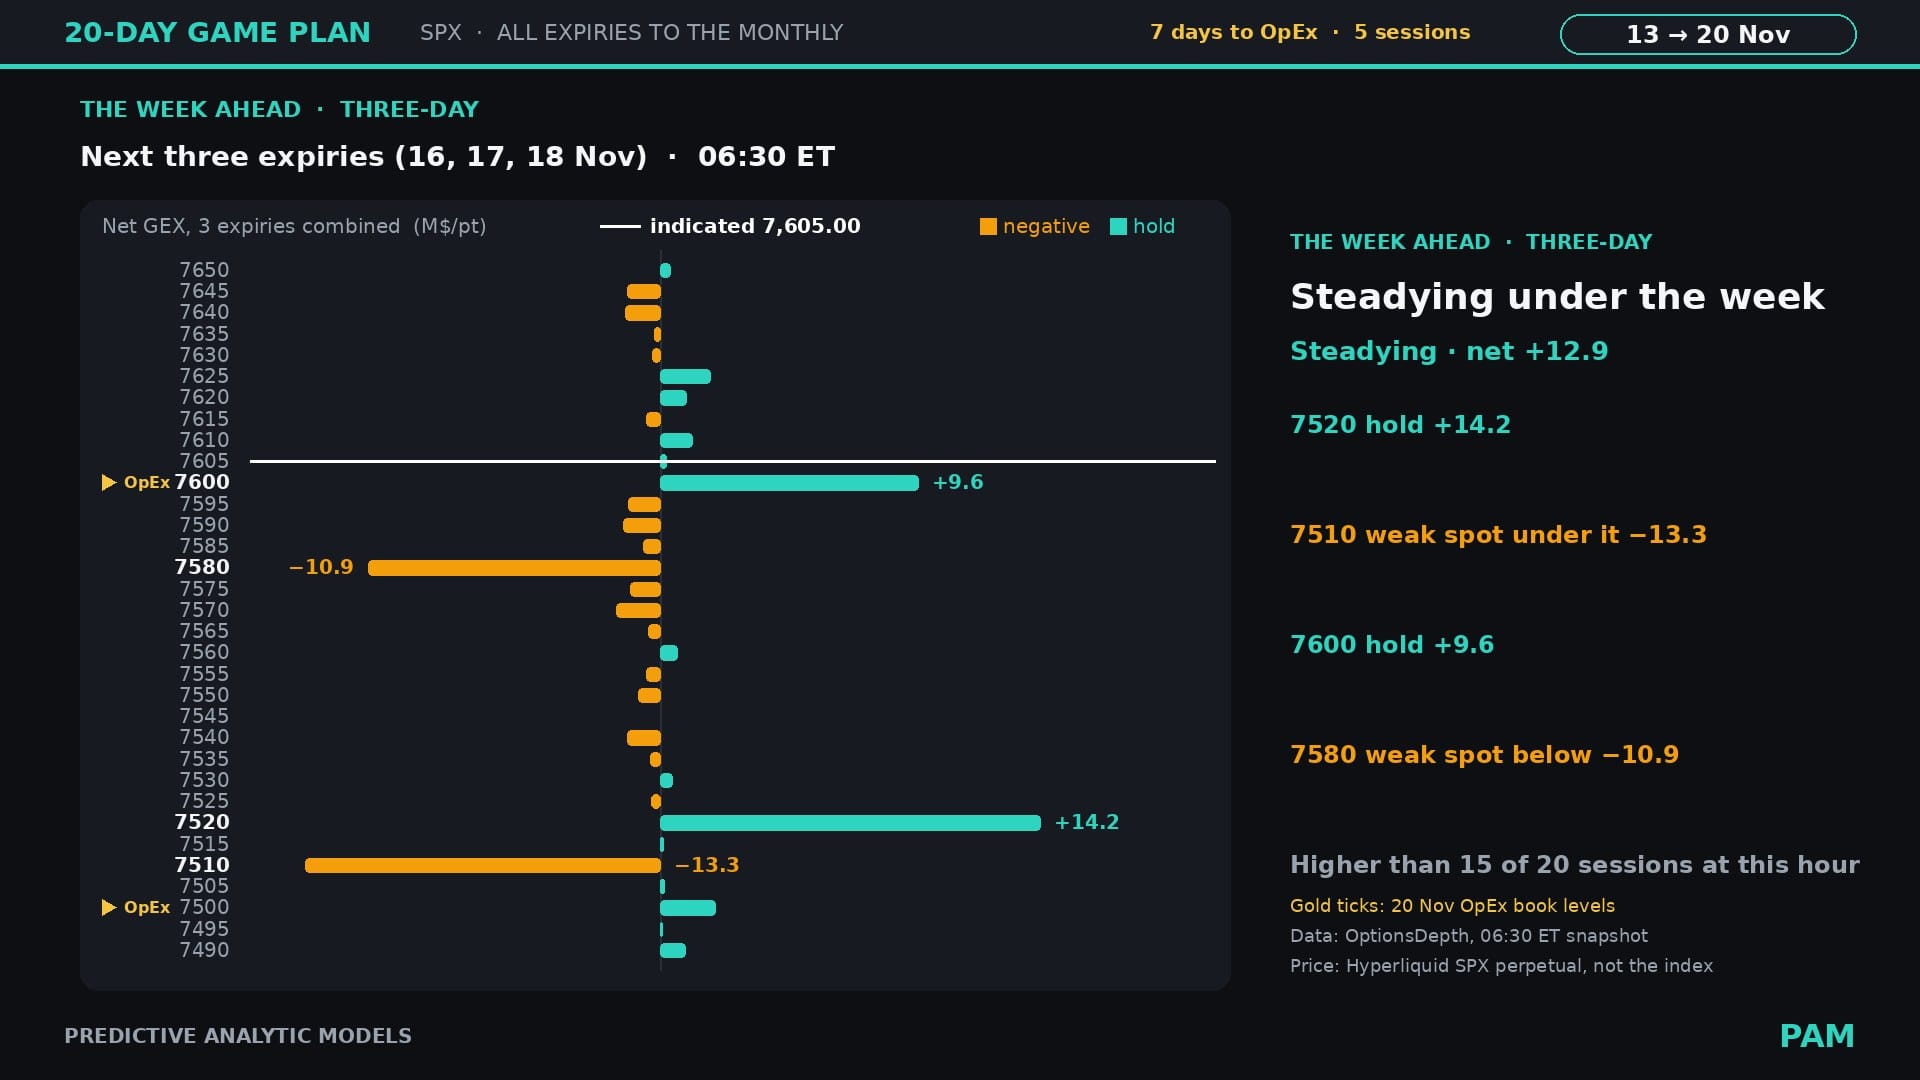
What you see: net GEX for the next three expiries combined, its state (steadying or amplifying), the main holds and weak spots, and how the total ranks against the last 20 sessions at the same hour.
How to use it: compare the week's state with the month's. A high ranking means the week's book is unusually heavy for this time of day.
For price: a steadying week inside an amplifying month tends to mean smaller day-to-day swings, while the month's edges still frame the bigger moves. An amplifying week inside an amplifying month tends to mean livelier sessions, and breaks that run.
Plate 6. The flow: Net Drift overnight
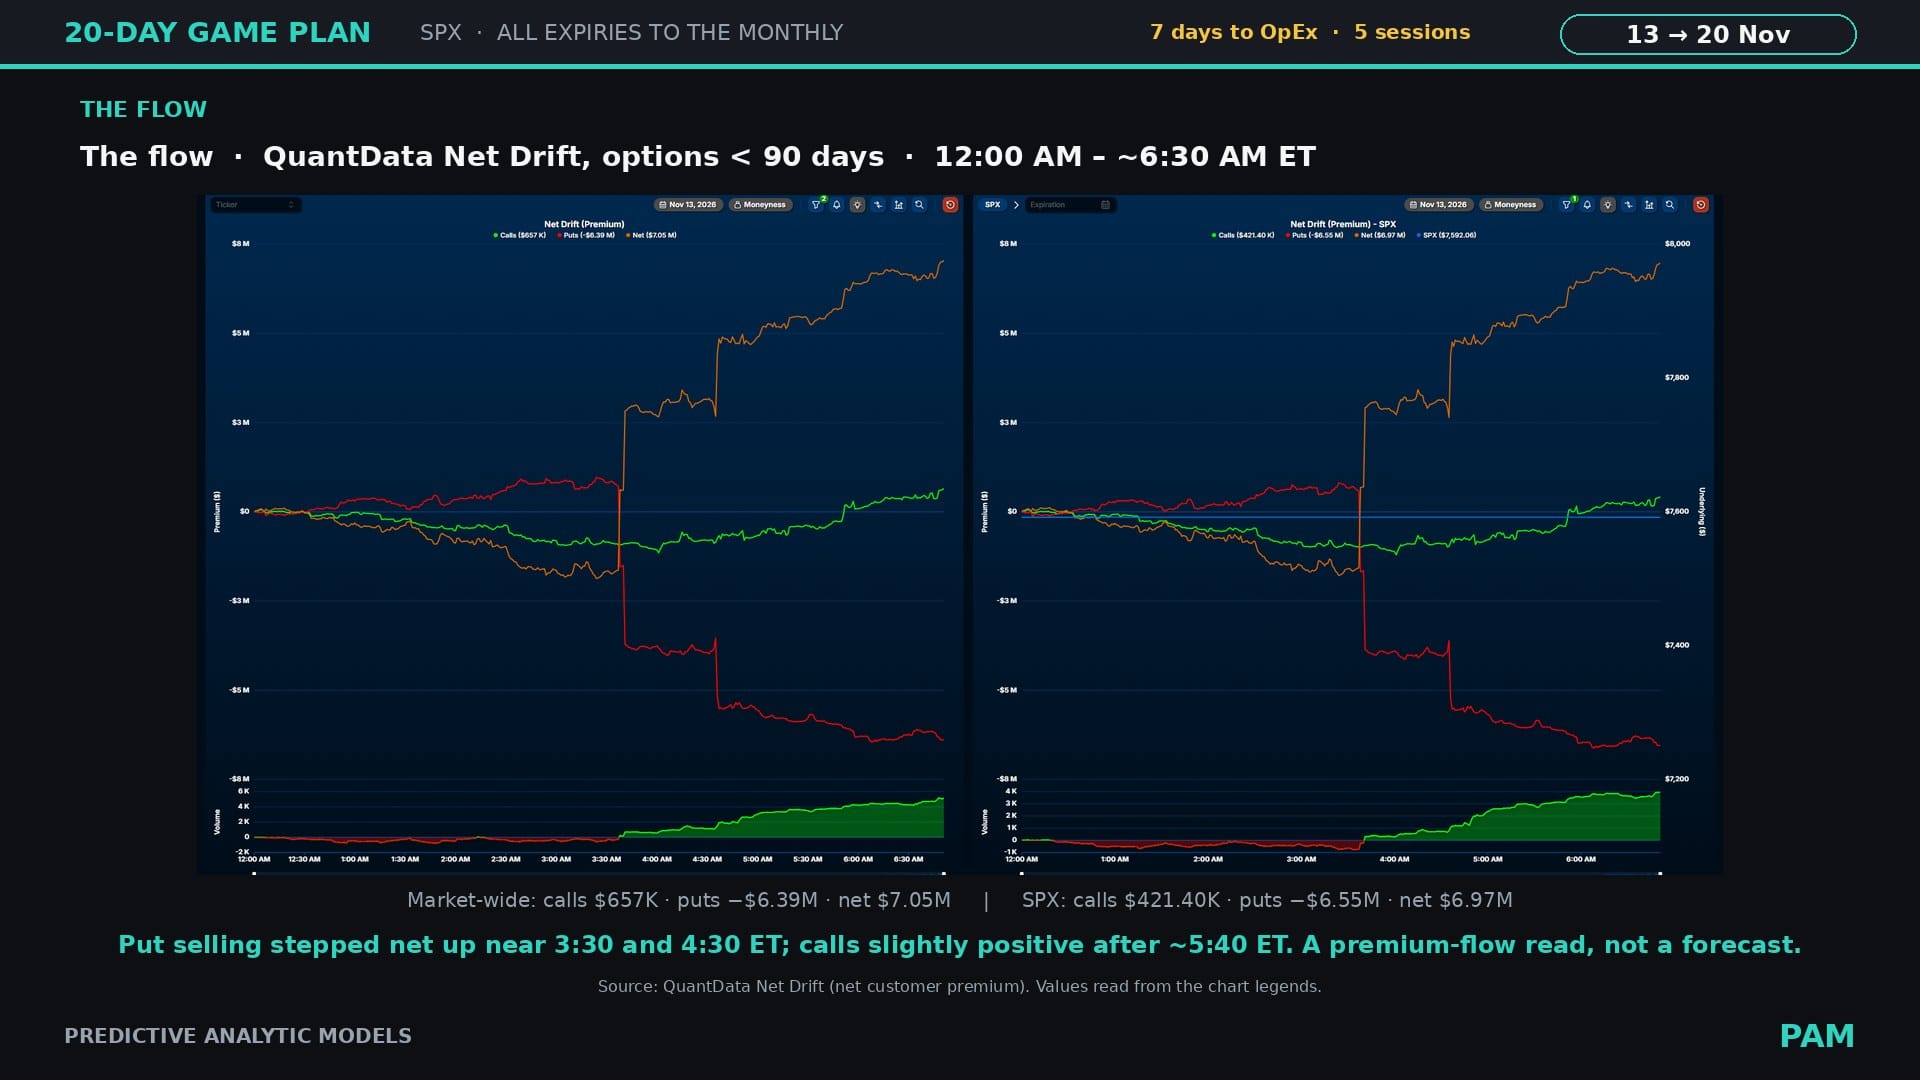
What you see: QuantData Net Drift for options under 90 days, from midnight to about 06:30 ET. Net Drift is a running total of option premium, with market-wide on the left and SPX on the right. Green is call premium, red is put premium and orange is the net. On the SPX panel, the blue line is the SPX price, and the bars at the bottom are volume. When calls climb and put premium fades, the net rises. When put premium climbs, it falls. Put selling shows as red falling below zero, which lifts the net.
The market-wide panel shows the broader trend of the day, and price tends to follow it over the session. SPX is the market's favored hedging instrument and has a narrower scope, so any major turn in the prevailing trend tends to show up first in SPX flows, even when volume is thin, as it often is overnight. Most splits between the two panels come from that hedging role.
For price: follow the market-wide panel for the day's trend. Rising net premium into the open tends to support early strength, and falling net premium tends to weigh on it. Treat a persistent SPX split as an early warning of a possible turn. On 13 November the two panels agreed: put selling stepped the net up near 03:30 and 04:30 ET, to about $7.05 million market-wide and $6.97 million on SPX.
Plate 7. Today's stakes: the 0DTE book
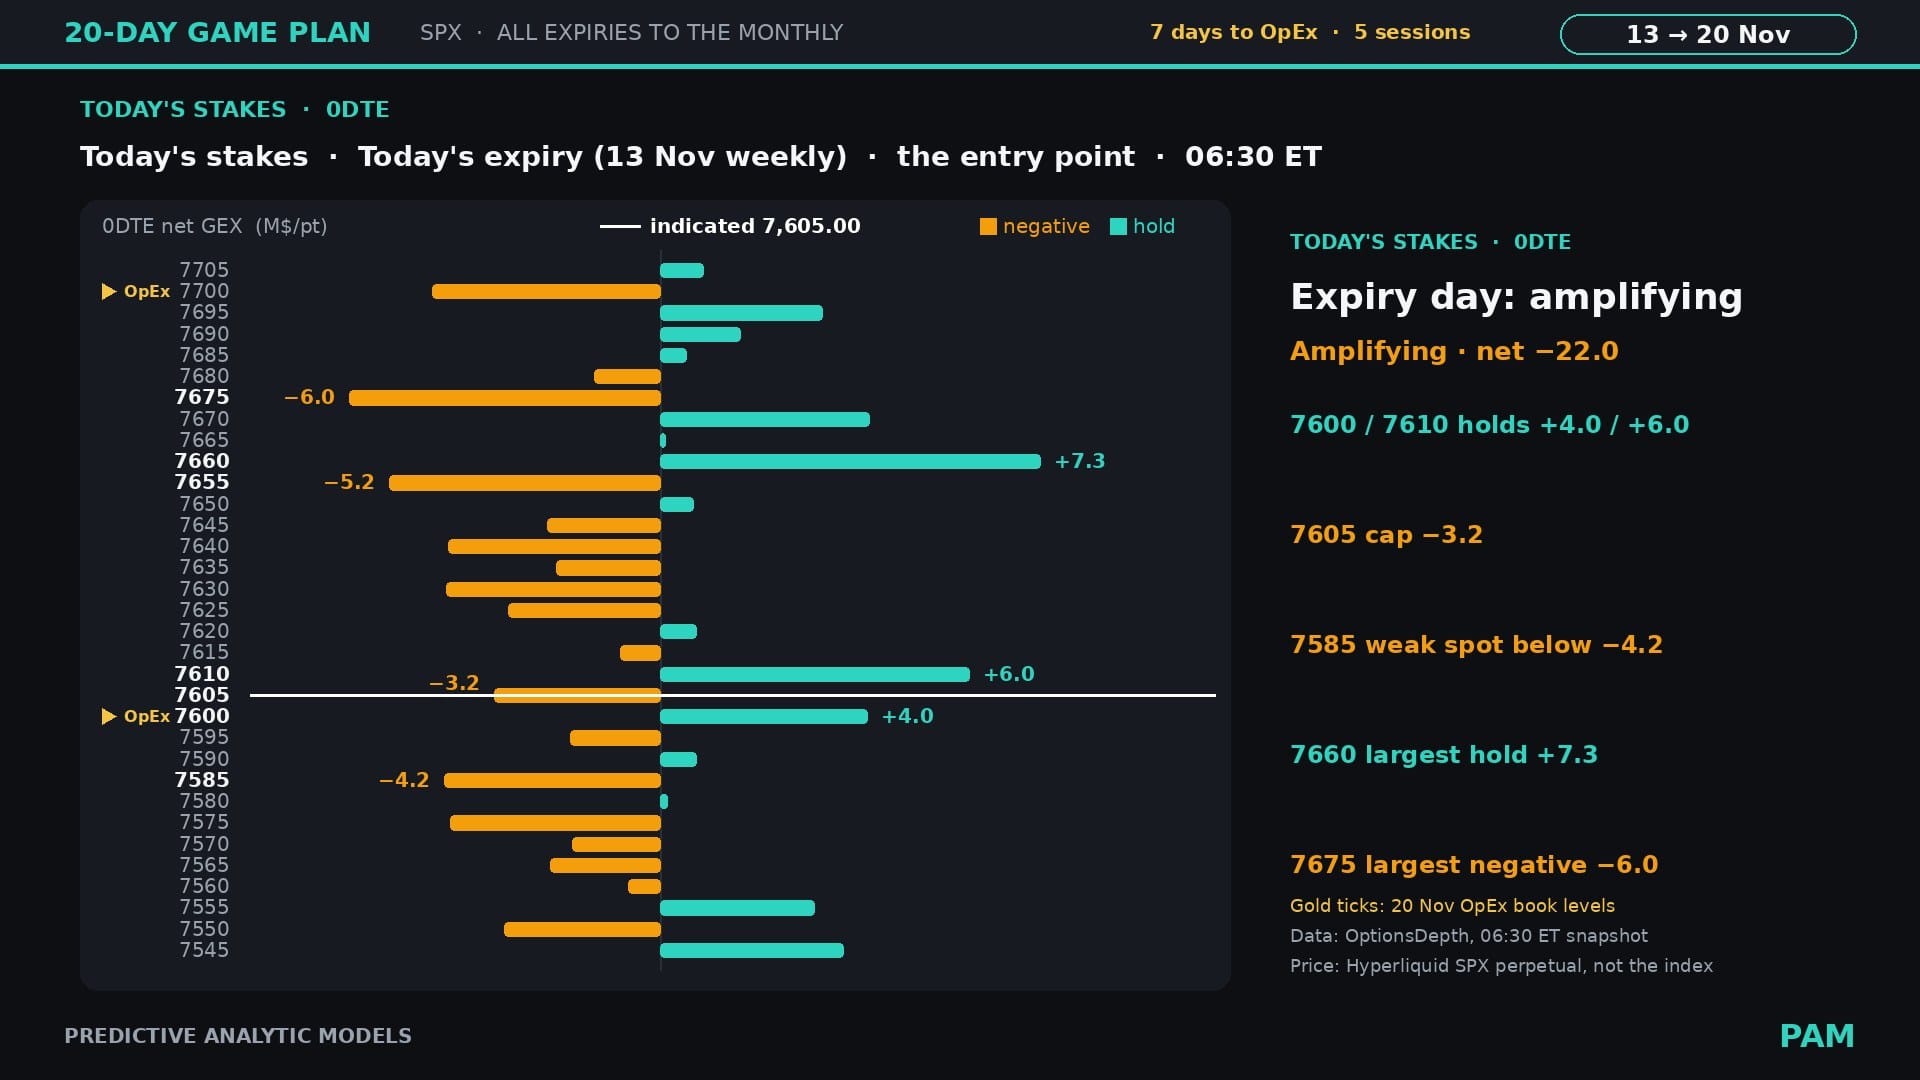
What you see: today's expiry only: the nearest holds and caps around the indicated level, the largest hold and the largest negative, and the book's state.
How to use it: this is where the session starts. The stance frames the days to OpEx, but the first moves after the open usually play out between the nearest 0DTE strikes.
For price: the nearest 0DTE holds tend to set the first pauses after the open. An amplifying 0DTE book tends to mean livelier intraday swings between them, and faster runs once one gives way.
Plate 8. The 0DTE Visual Queue Map
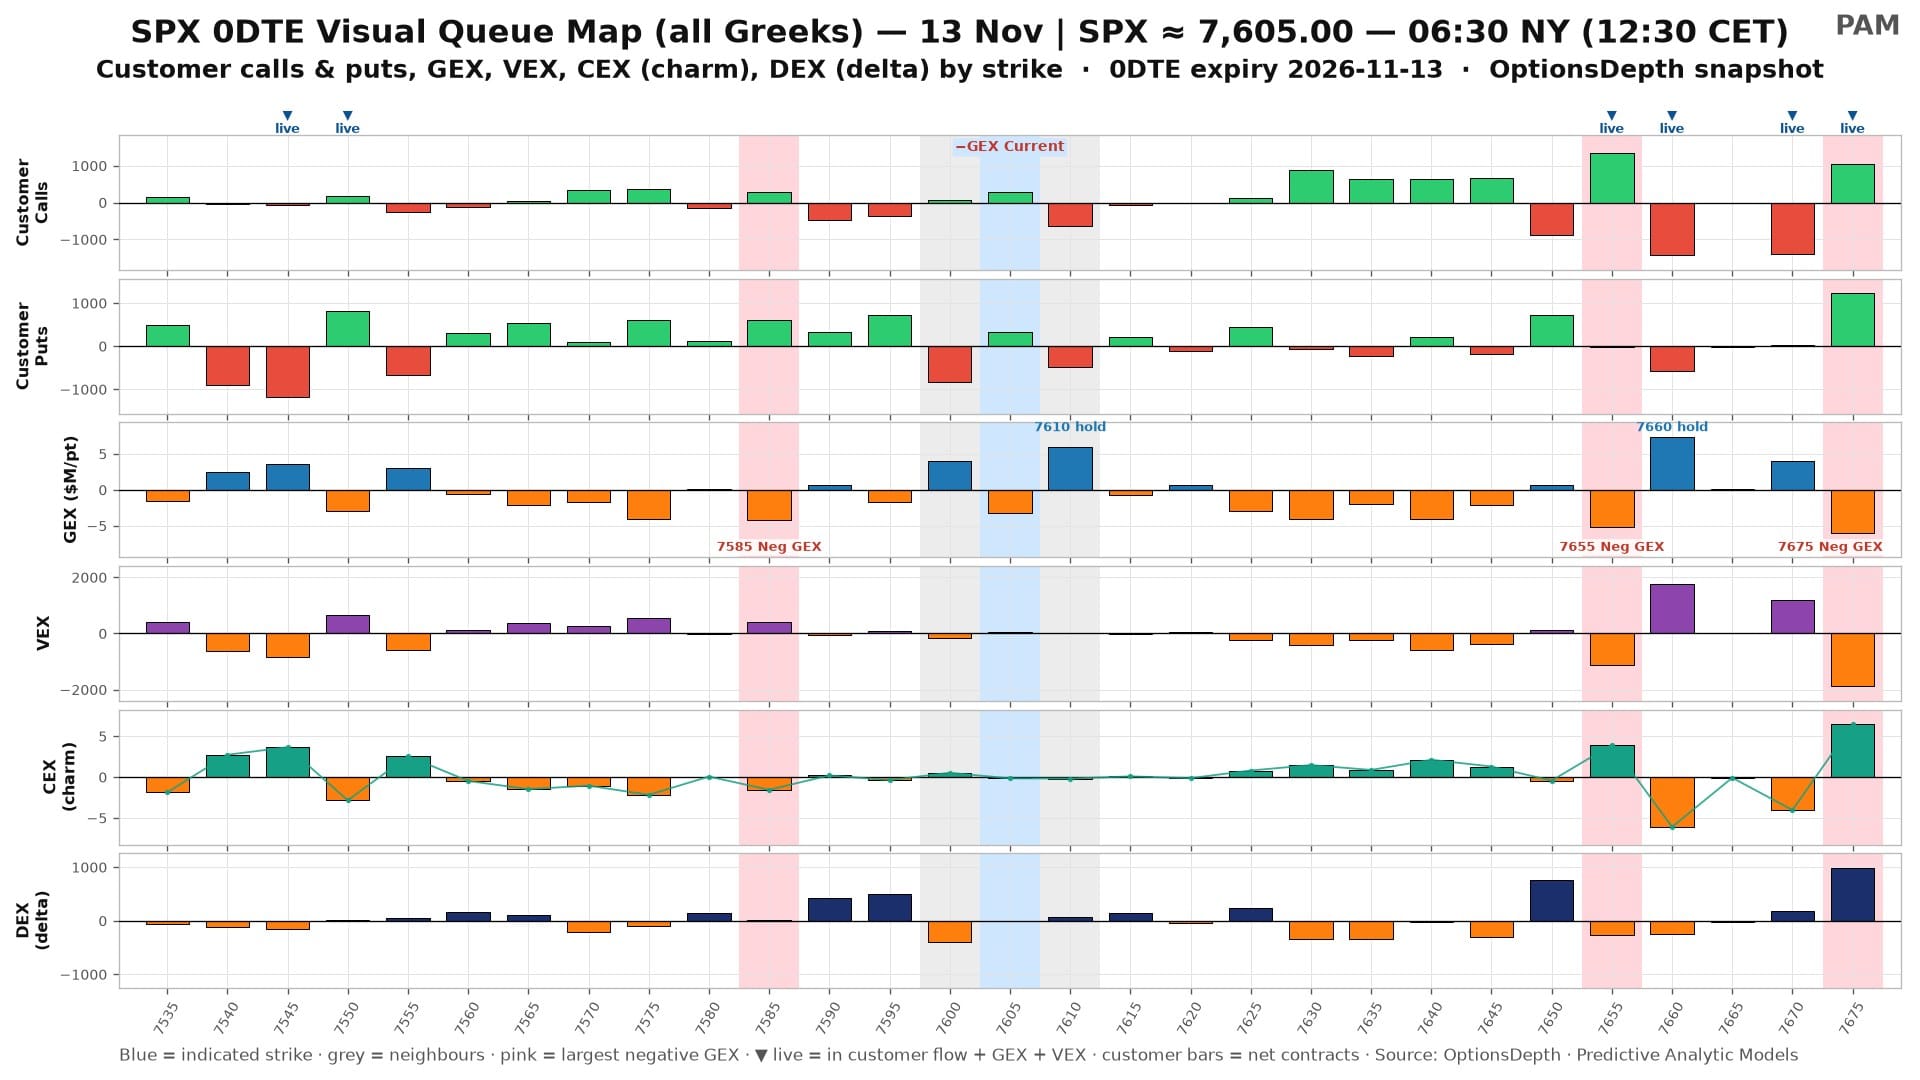
This is the densest plate. The six panels share one strike axis, so read straight down a column.
- Customer calls and 2. customer puts: net contracts, green bought and red sold (see the section above).
- GEX: blue is positive (hold), orange is negative.
- VEX (vanna): purple is positive, orange is negative.
- CEX (charm): teal is positive, orange is negative. The thin line through the bar tops is the charm "wave", and it shows where the sign swings from one side to the other.
- DEX (delta): navy is positive, orange is negative. See the appendix.
The light-blue column is the strike nearest the indicated level, and the label above it gives that strike's GEX sign. Light-grey columns are its neighbours, and pink columns are the three most negative GEX strikes in view. Blue "hold" tags mark the two largest holds. Start with the customer rows, then read down each column. For VEX and CEX, read the sign and the relative size, not the units.
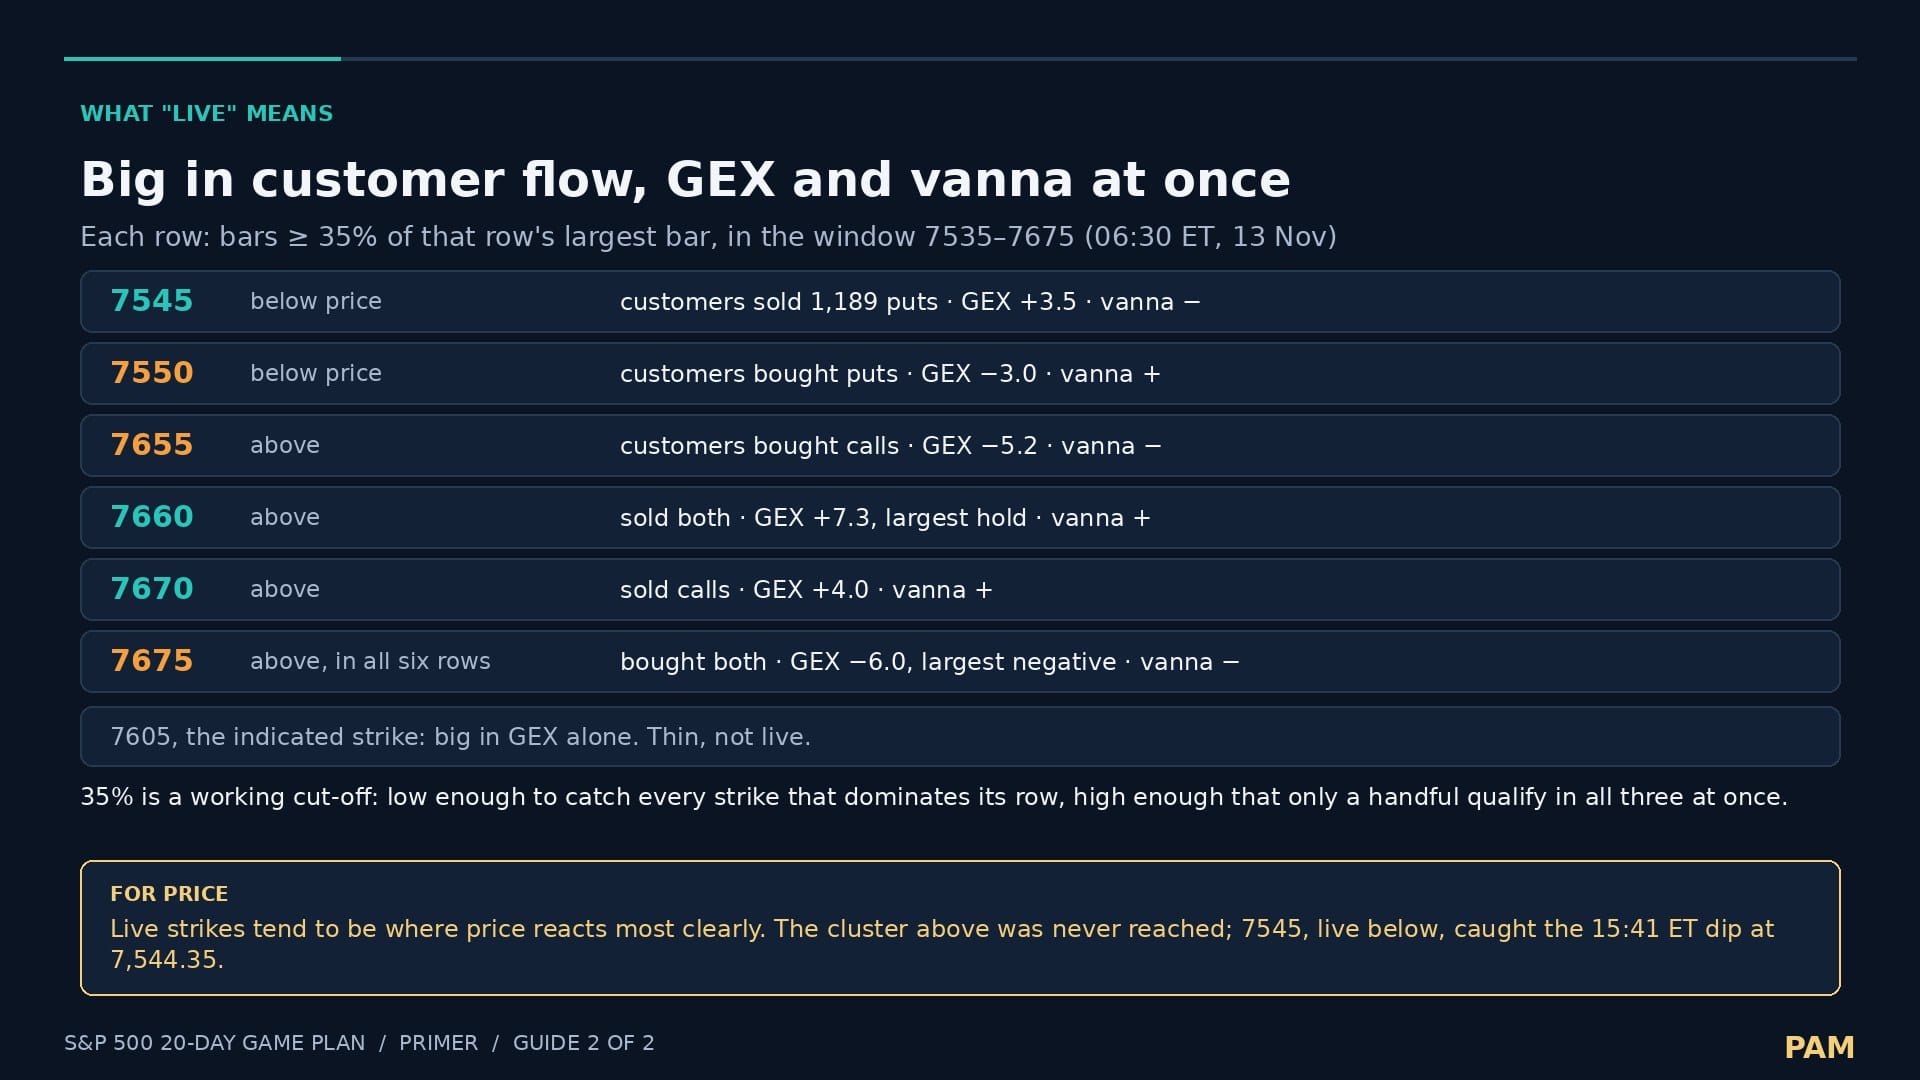
What "live" means. The marker is computed by the chart code. It takes a window of strikes around price (7535–7675 on the 13 Nov 06:30 ET map) and finds each row's largest bar by size, ignoring sign. A strike is significant in a row if its bar is at least 35% of that largest bar. It is live when it is significant in customer flow (calls or puts), GEX and VEX at once. Because the cut-off is relative, it scales with each day's book, and only the few strikes big in all three rows qualify. A live strike can be a hold or a cap. 35% is a working cut-off: low enough to catch every strike that dominates its row, high enough that only a handful qualify in all three at once. At 06:30 ET on 13 November, six strikes were live: 7545 and 7550 below price, and 7655, 7660, 7670 and 7675 above it. 7675 was significant in all six rows. The indicated strike, 7605, was significant in GEX alone: thin, not live.
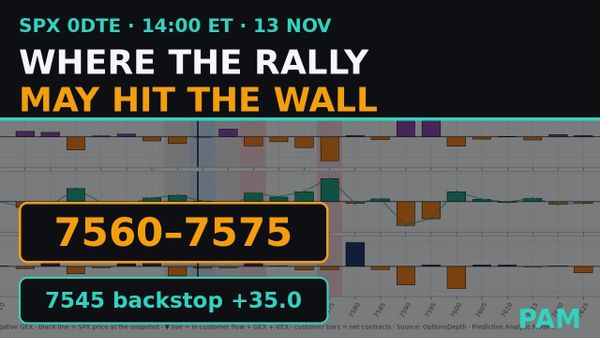
For price: where customer positioning and two kinds of dealer hedging are all heavy, price tends to react most clearly. Strikes strong in several rows tend to give a firm pin or a break that runs, and single-row strikes tend to give weak reactions. Where charm swings sign on expiry day, the afternoon tends to turn more two-sided. On 13 November the live cluster above (7655–7675) was never reached, but 7545, live below, was the strike the afternoon came back to: by 15:16 ET it was the only live strike, and it caught the 15:41 ET dip at 7,544.35.
Later in the day: the close
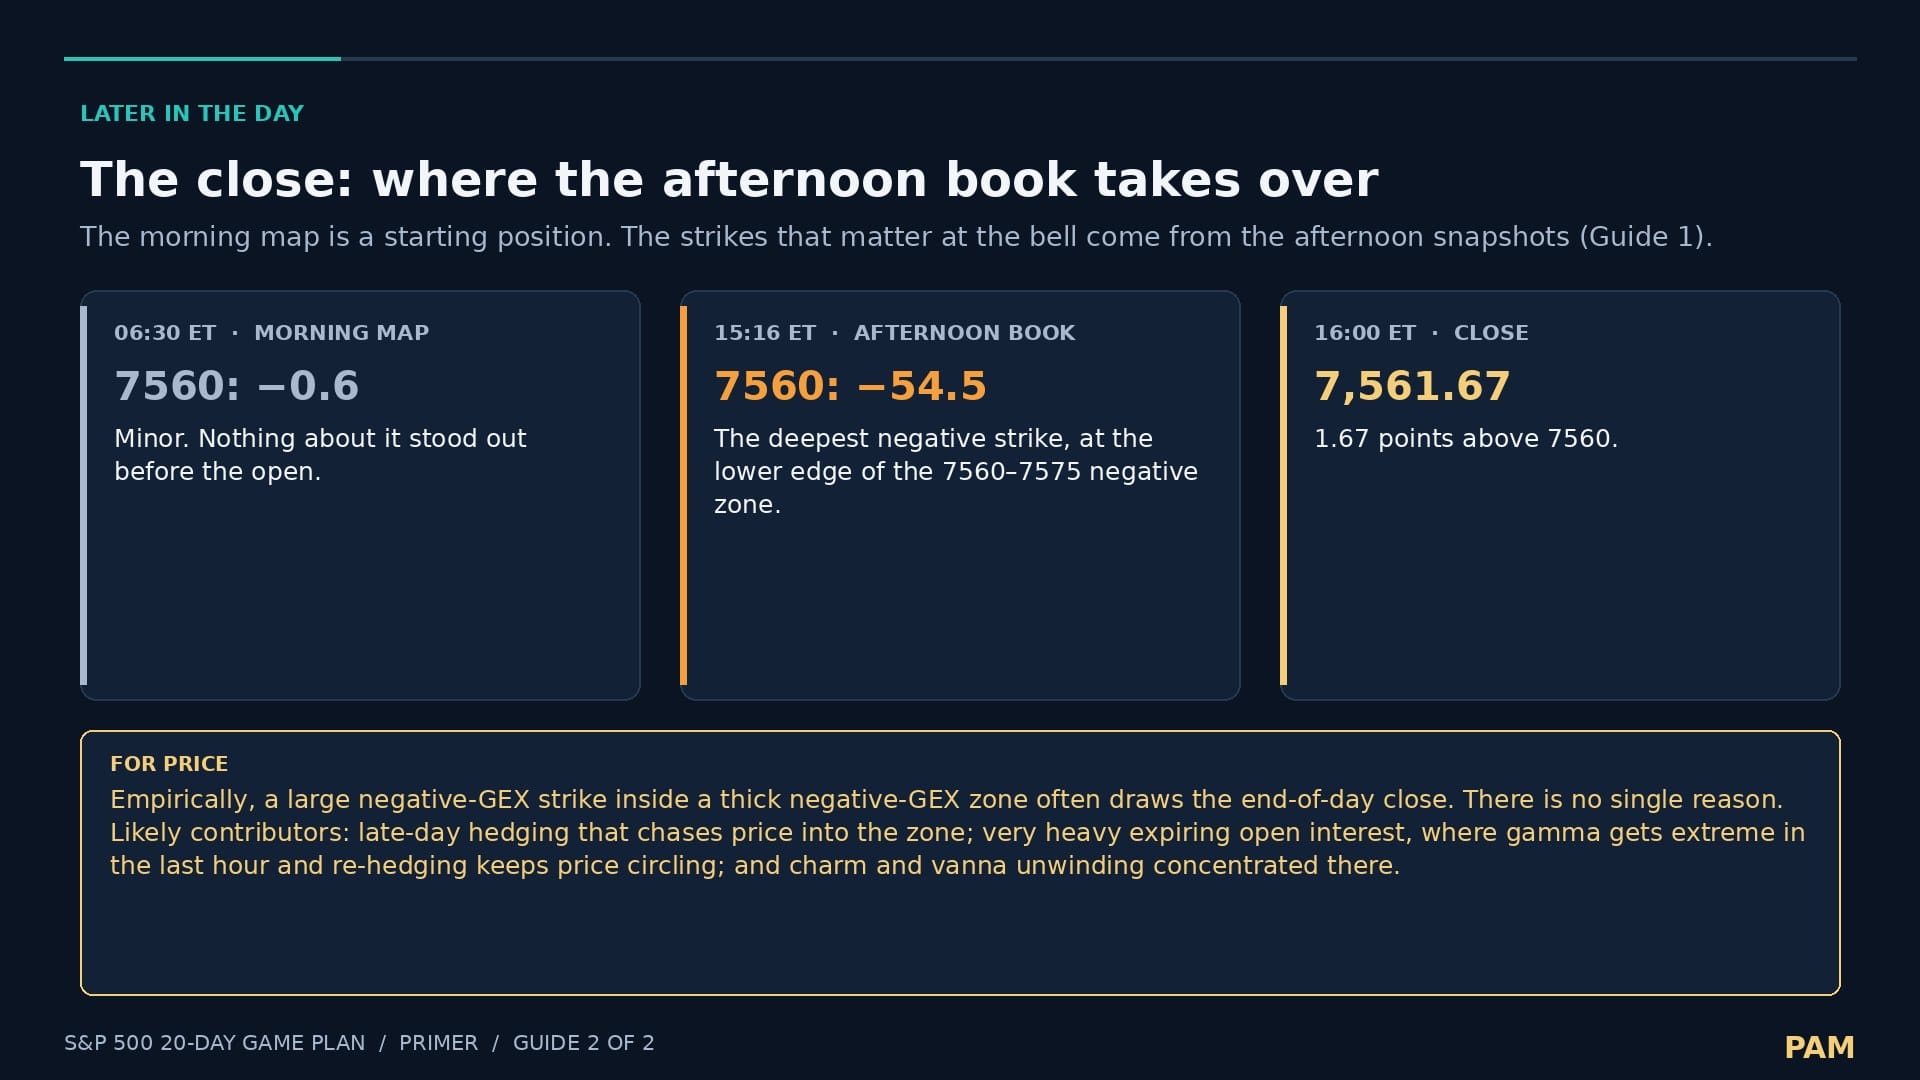
The morning map is a starting position. The 0DTE book keeps changing through the session, and the strikes that matter at the bell are read from the afternoon snapshots in the EOD recap (Guide 1).
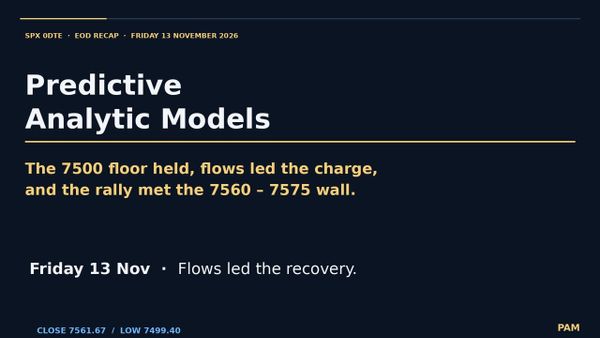
For price: empirically, a large negative-GEX strike inside a thick negative-GEX zone often draws the end-of-day close. There is no single reason. Likely contributors are late-day hedging that chases price into the zone, and very heavy expiring open interest at those strikes: gamma there gets extreme in the last hour, so re-hedging keeps price circling. A third is charm and vanna unwinding concentrated at those strikes. On 13 November, 7560 was minor at 06:30 ET (−0.6), but by 15:16 ET it was the deepest negative strike (−54.5), at the lower edge of the 7560–7575 negative zone. The S&P 500 closed at 7,561.67, 1.67 points above it.
Plate 9. What would confirm or break the plan
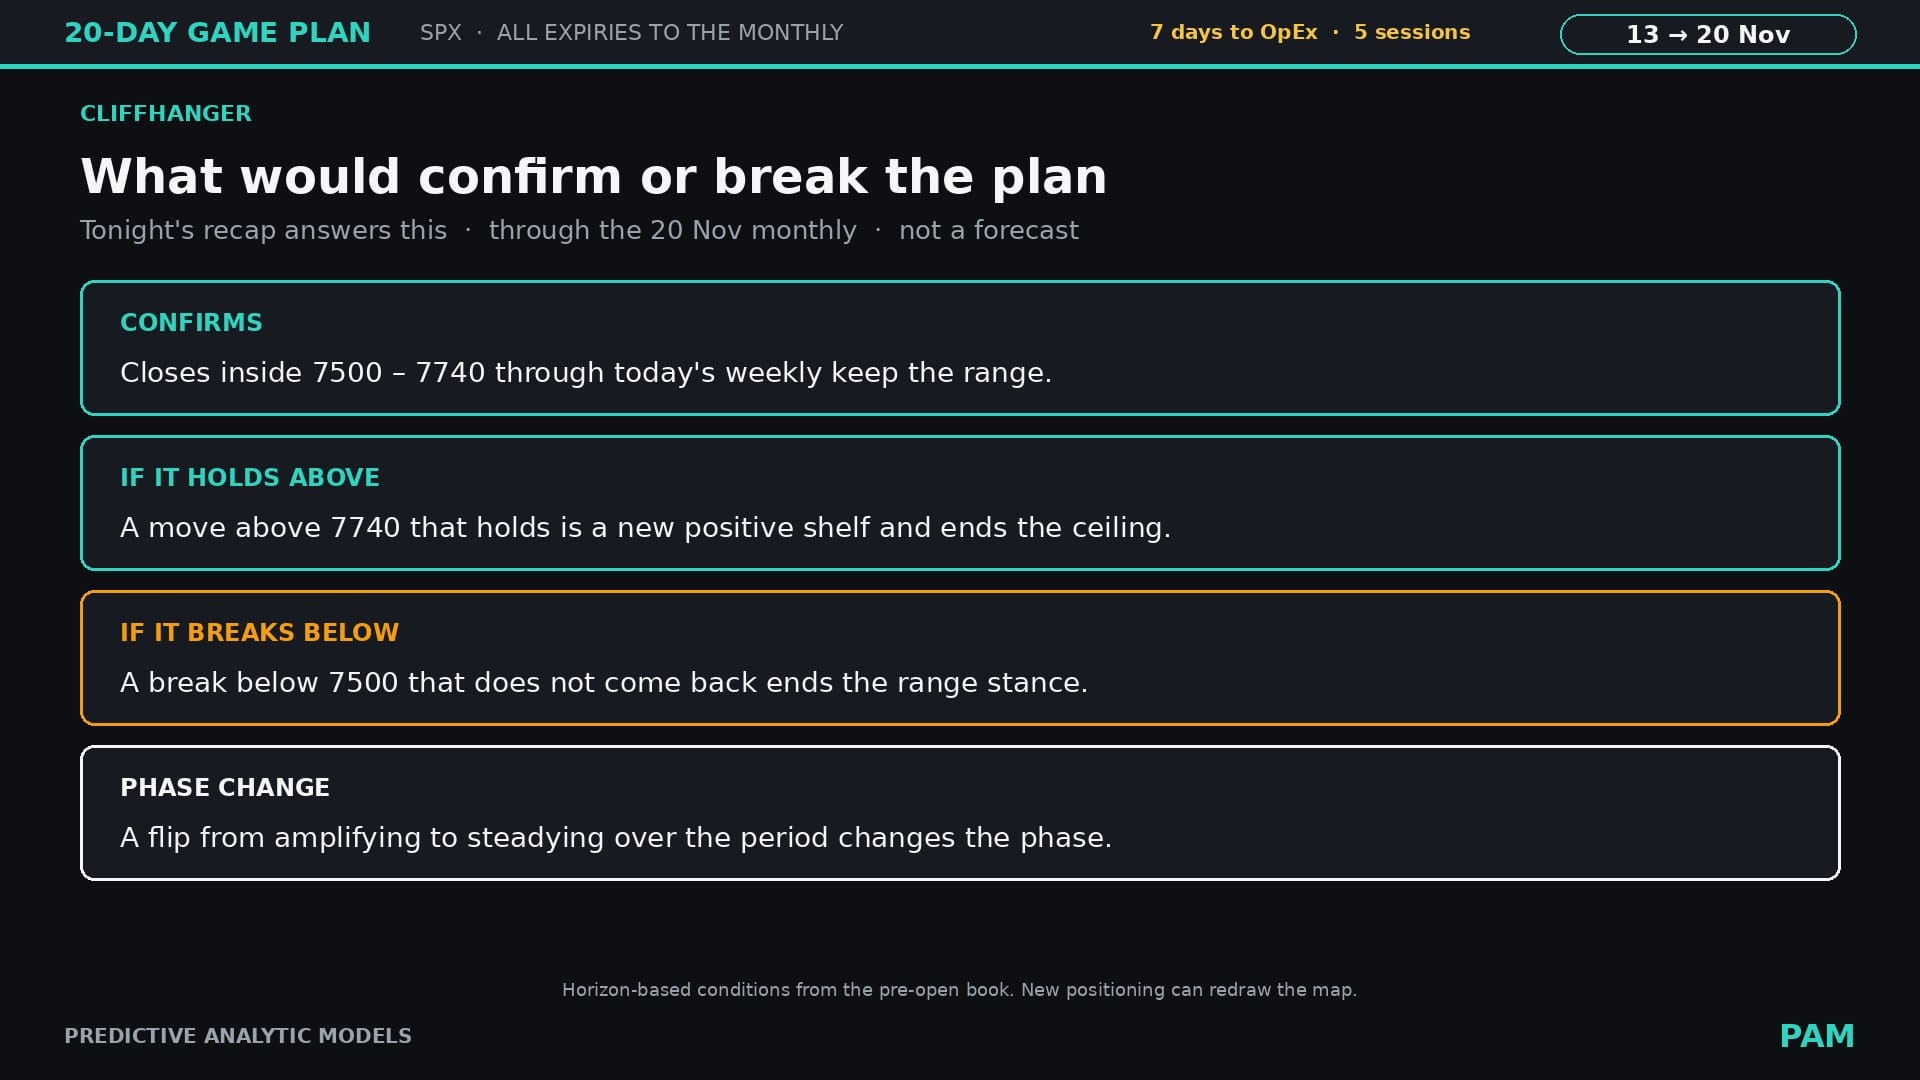
What you see: four conditions: what confirms the stance, what happens if price holds above the ceiling, what happens if it breaks below the weak spot, and what a phase change looks like. Note the wording "that holds" and "that does not come back": a brief poke doesn't count.
How to use it: this is the rulebook the evening recap uses to score the day. Hold every intraday move up against it.
For price: a hold above the ceiling tends to turn it into a new floor, a positive shelf, and the next Game Plan tends to redraw higher. A break below the weak spot that sticks tends to run to the next hold below, faster in an amplifying book. A phase change, from amplifying to steadying or back, tends to change the size of the swings more than their direction.
Worked example: Friday 13 November 2026
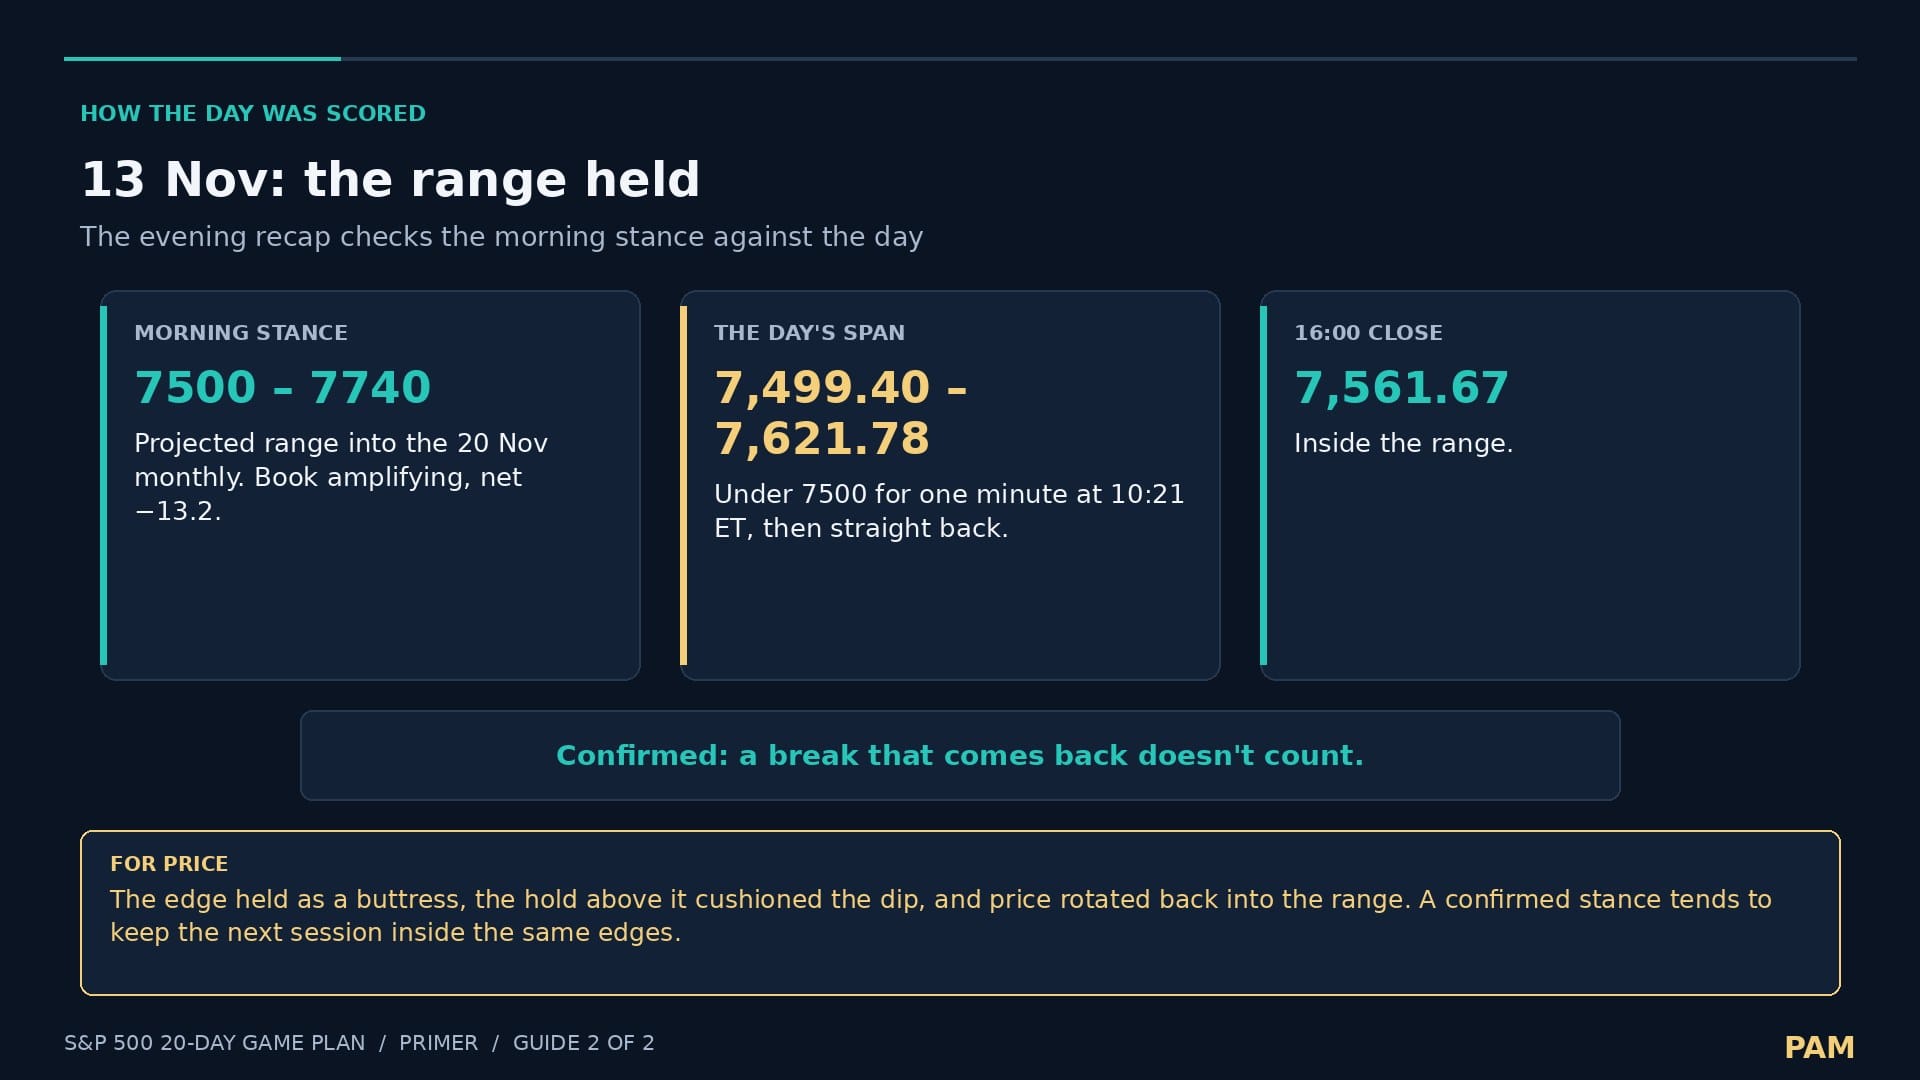
- Start and stance. Thursday closed at 7,592.40, and the indicated level was 7,605.00, about 13 points higher. The stance was a projected range of 7500–7740 into the 20 November monthly, 7 days and 5 sessions away, with the book amplifying at net −13.2. The ceiling was 7740 (+12.6), the weak spot 7500 (−14.4), and the hold above it 7520 (+12.4). Price read: a mid-range start, then rotation inside the edges, with livelier swings.
- Map and bands. The 50% band ran about 7458–7748 and the 80% band 7331–7883. Closer in, 7600 held at +10.8, with a weak spot at 7580 (−11.4). Price read: the edges sat near the band edges, so a test of either edge would meet a big book level.
- OpEx agreement. The 20 November book alone agreed on the edges, 7740 its largest hold (+11.3) and 7500 its largest negative (−16.8), and split at 7600 (+10.8 across the window, −3.5 on the monthly). Price read: sturdy edges, and chop near 7600.
- Week ahead. The next three expiries were steadying, net +12.9, higher than 15 of the last 20 sessions at that hour, with 7520 the hold (+14.2) over a 7510 weak spot (−13.3). Price read: smaller day-to-day swings inside the month's edges.
- Flow. Overnight, put selling lifted the net on both Net Drift panels, which agreed. Price read: no early warning from the SPX panel.
- 0DTE. Today's expiry was amplifying, net −22.0. The indicated level sat on a small 7605 cap (−3.2), between the 7600 (+4.0) and 7610 (+6.0) holds, with 7585 (−4.2) the weak spot below. Price read: lively swings between nearby strikes, with 7585 and then the 7545/7550 live pair below if the open slipped.
- What happened. Market-wide selling took the S&P 500 from a 7,616.85 open toward the weak spot. It touched 7,499.40 at 10:21 ET, under 7500, for one minute, and came straight back. The afternoon rallied into the 7560–7575 zone, and the index closed at 7,561.67. The range held, and the recap scored the stance confirmed. Price read: the edge held as a buttress, the hold above it cushioned the dip, and price rotated back into the range.
Your checklist
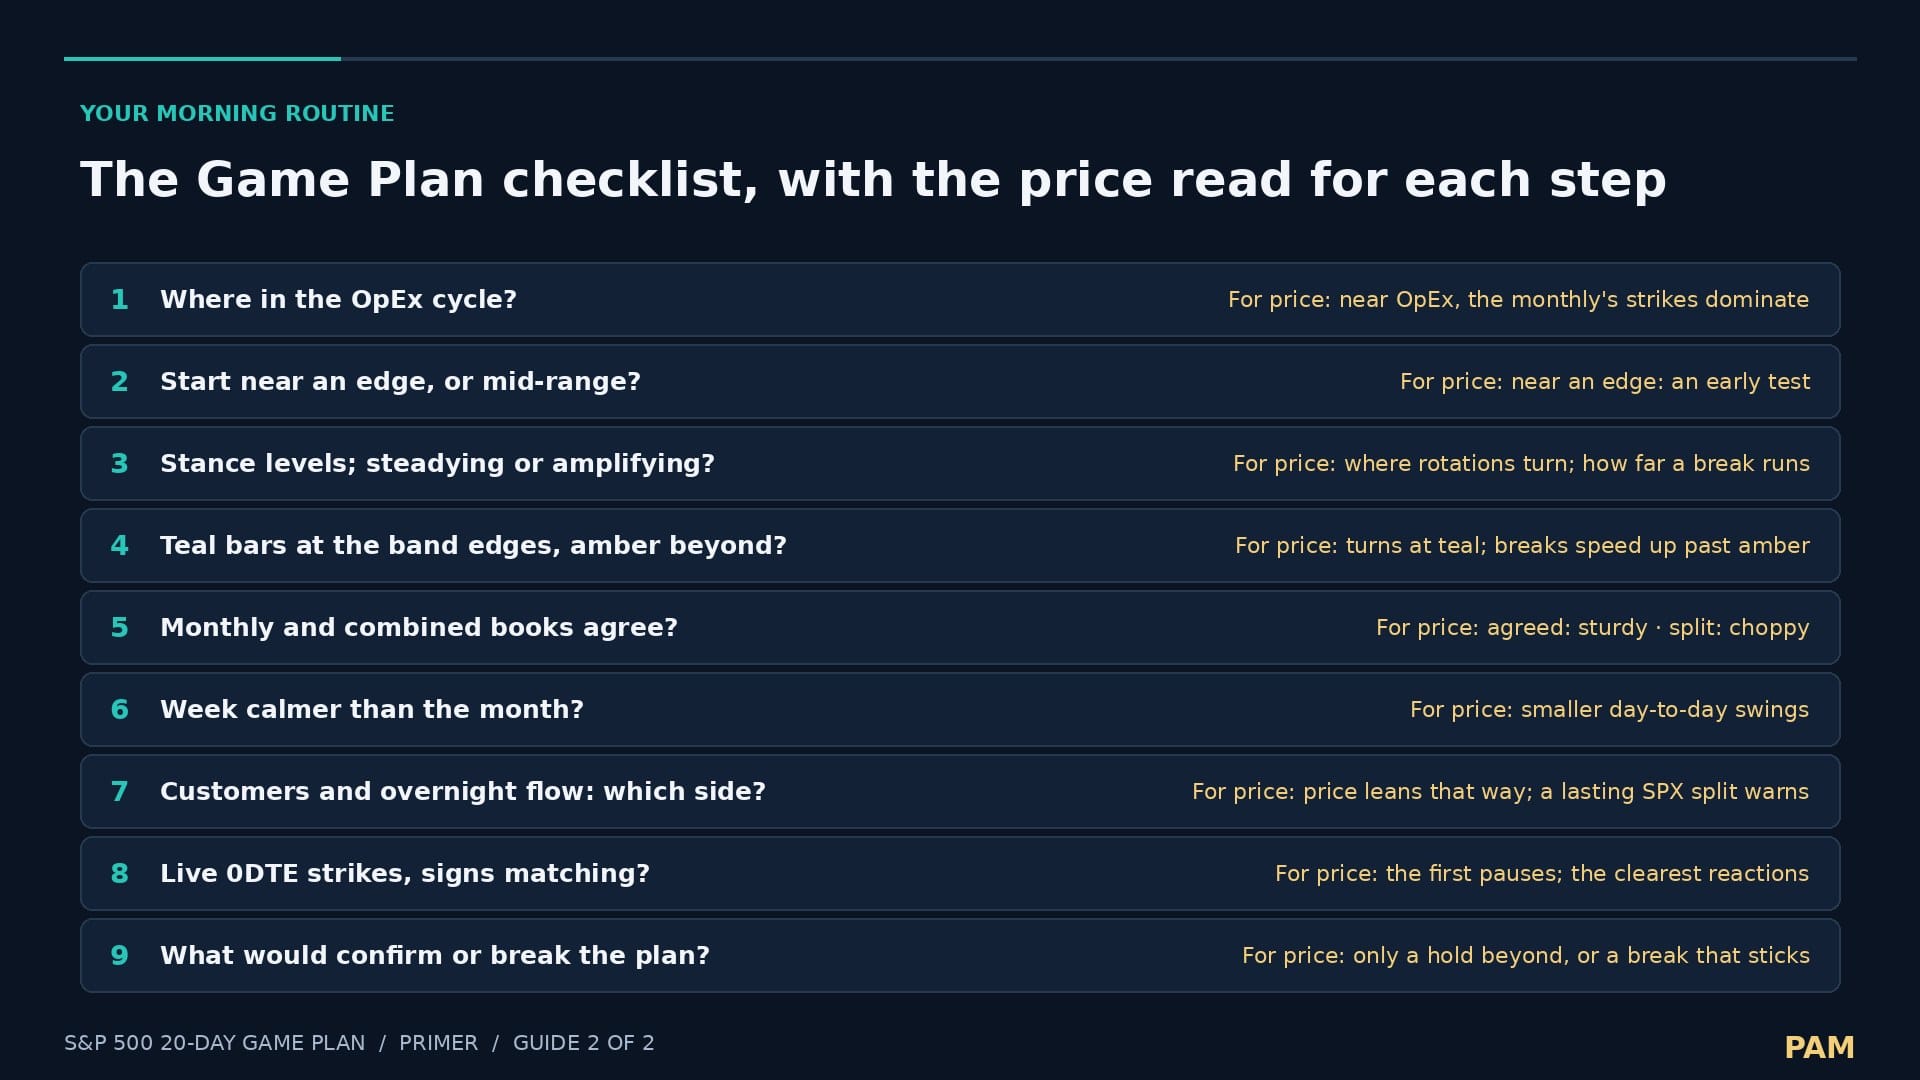
- Where in the cycle? How many sessions to OpEx? For price: the closer OpEx is, the more the monthly's big strikes tend to dominate.
- Start vs range: near an edge, or mid-range? For price: near an edge tends to mean an early test.
- Stance levels and state: ceiling, weak spot, the hold above it, steadying or amplifying? For price: where rotations tend to turn, and how far a break tends to run.
- Map edges vs bands: teal bars at the band edges, orange clusters beyond? For price: teal bars turn price, and orange clusters beyond them speed up breaks.
- OpEx agreement: do the monthly and the combined books agree? For price: agreed levels are sturdy, split ones choppy.
- Week's state: steadying or amplifying, and how unusual? For price: steadying means smaller swings, amplifying bigger ones.
- Customer rows and overnight flow: which side are the flows building, and do the SPX flows split from market-wide? For price: price tends to lean toward the side the flows build, and a lasting SPX split is an early warning of a turn.
- 0DTE book and Queue Map: the nearest holds, the live strikes, the matching signs? For price: the first pauses, and where the session reacts most.
- Confirm or break: what would redraw the map? For price: only a hold beyond an edge, or a break that sticks, redraws it.
New positioning can redraw the map at any time. Treat every level as a reference point, not a promise.
Why there are two animations, and how they fit together
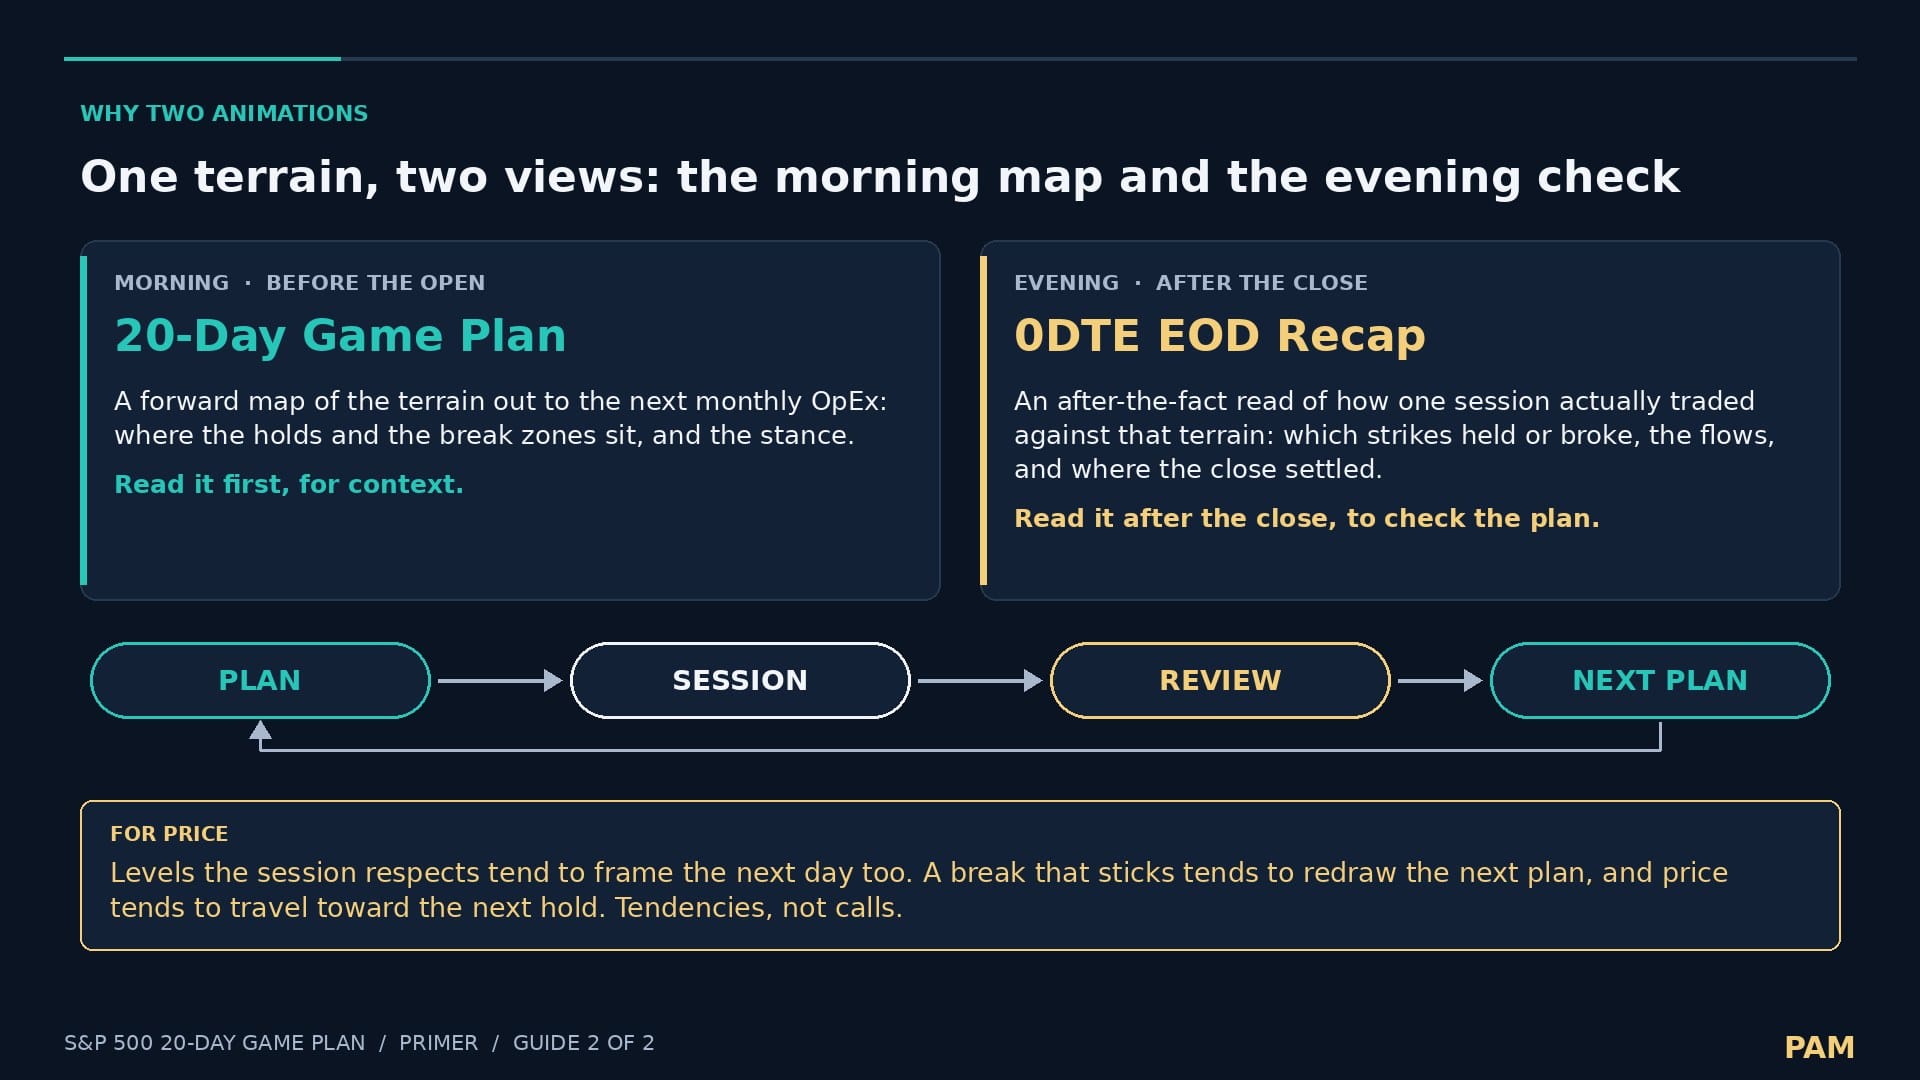
The Game Plan and the EOD Recap answer two different questions about the same options book.
- The 20-Day Game Plan is the morning view. Before the open, it maps the terrain out to the next monthly OpEx: where the holds and the break zones sit across several sessions, and the stance that follows from them. It is forward-looking, and it covers many sessions at once.
- The 0DTE EOD Recap is the evening view. After the close, it reads how one session actually traded against that terrain: which strikes held and which broke, what the flows did, and where the close settled. It looks back, and it covers one session in detail.
Read the Game Plan first, for context, and the Recap after the close, to check it. Together they form a loop: plan, session, review, next plan. Each recap scores the morning's stance as confirmed or broken, and the next morning's Game Plan starts from the book that session left behind.
For price: levels the session respects tend to frame the next session too, so the same edges and holds stay the first references. A break that sticks tends to redraw the next plan, with price tending to travel toward the next hold beyond it. Tendencies, not calls.
Appendix: DEX, for special situations
DEX (delta exposure) is the market makers' net directional exposure per strike, the bottom Queue Map panel. With the customer rows read properly, it adds little on most days, except in three situations:
- Large DEX concentrated at a strike near the 0DTE close. Those hedges unwind as the options head to zero or to full delta. For price: price can move sharply around that strike late in the day.
- DEX leaning the opposite way to the customer flows. The hedges are lagging the flow. For price: price tends to catch up toward the flow side.
- Heavy DEX at a level where negative GEX breaks. The hedge adjustment adds fuel. For price: the move tends to run further.
Get the Game Plan, the EOD recap and the advisories by email, free: Subscribe at Predictive Analytic Models
Educational only.