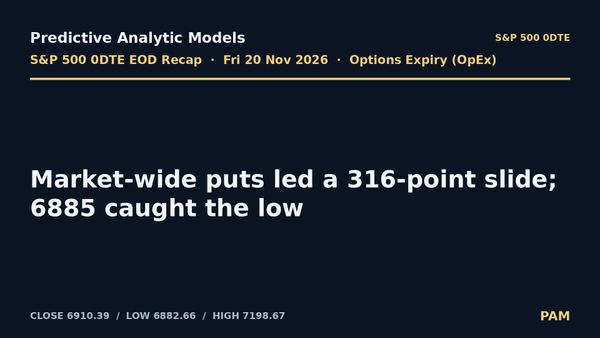
The Positioning Map and the S&P 500 Options Map Are in Sync: Fast Money Is Short, Real Money Is Long
Investor positioning (hedge funds short, real money and retail still long) and the S&P 500 options gamma map after Options Expiry (OpEx) are in sync: negative gamma above Friday's 6910 close, positive gamma below. Part 1 of 2; Part 2, on who does what in a sell-off, comes next.
The Part 1 film: the positioning map and the S&P 500 options map are in sync (4:53).
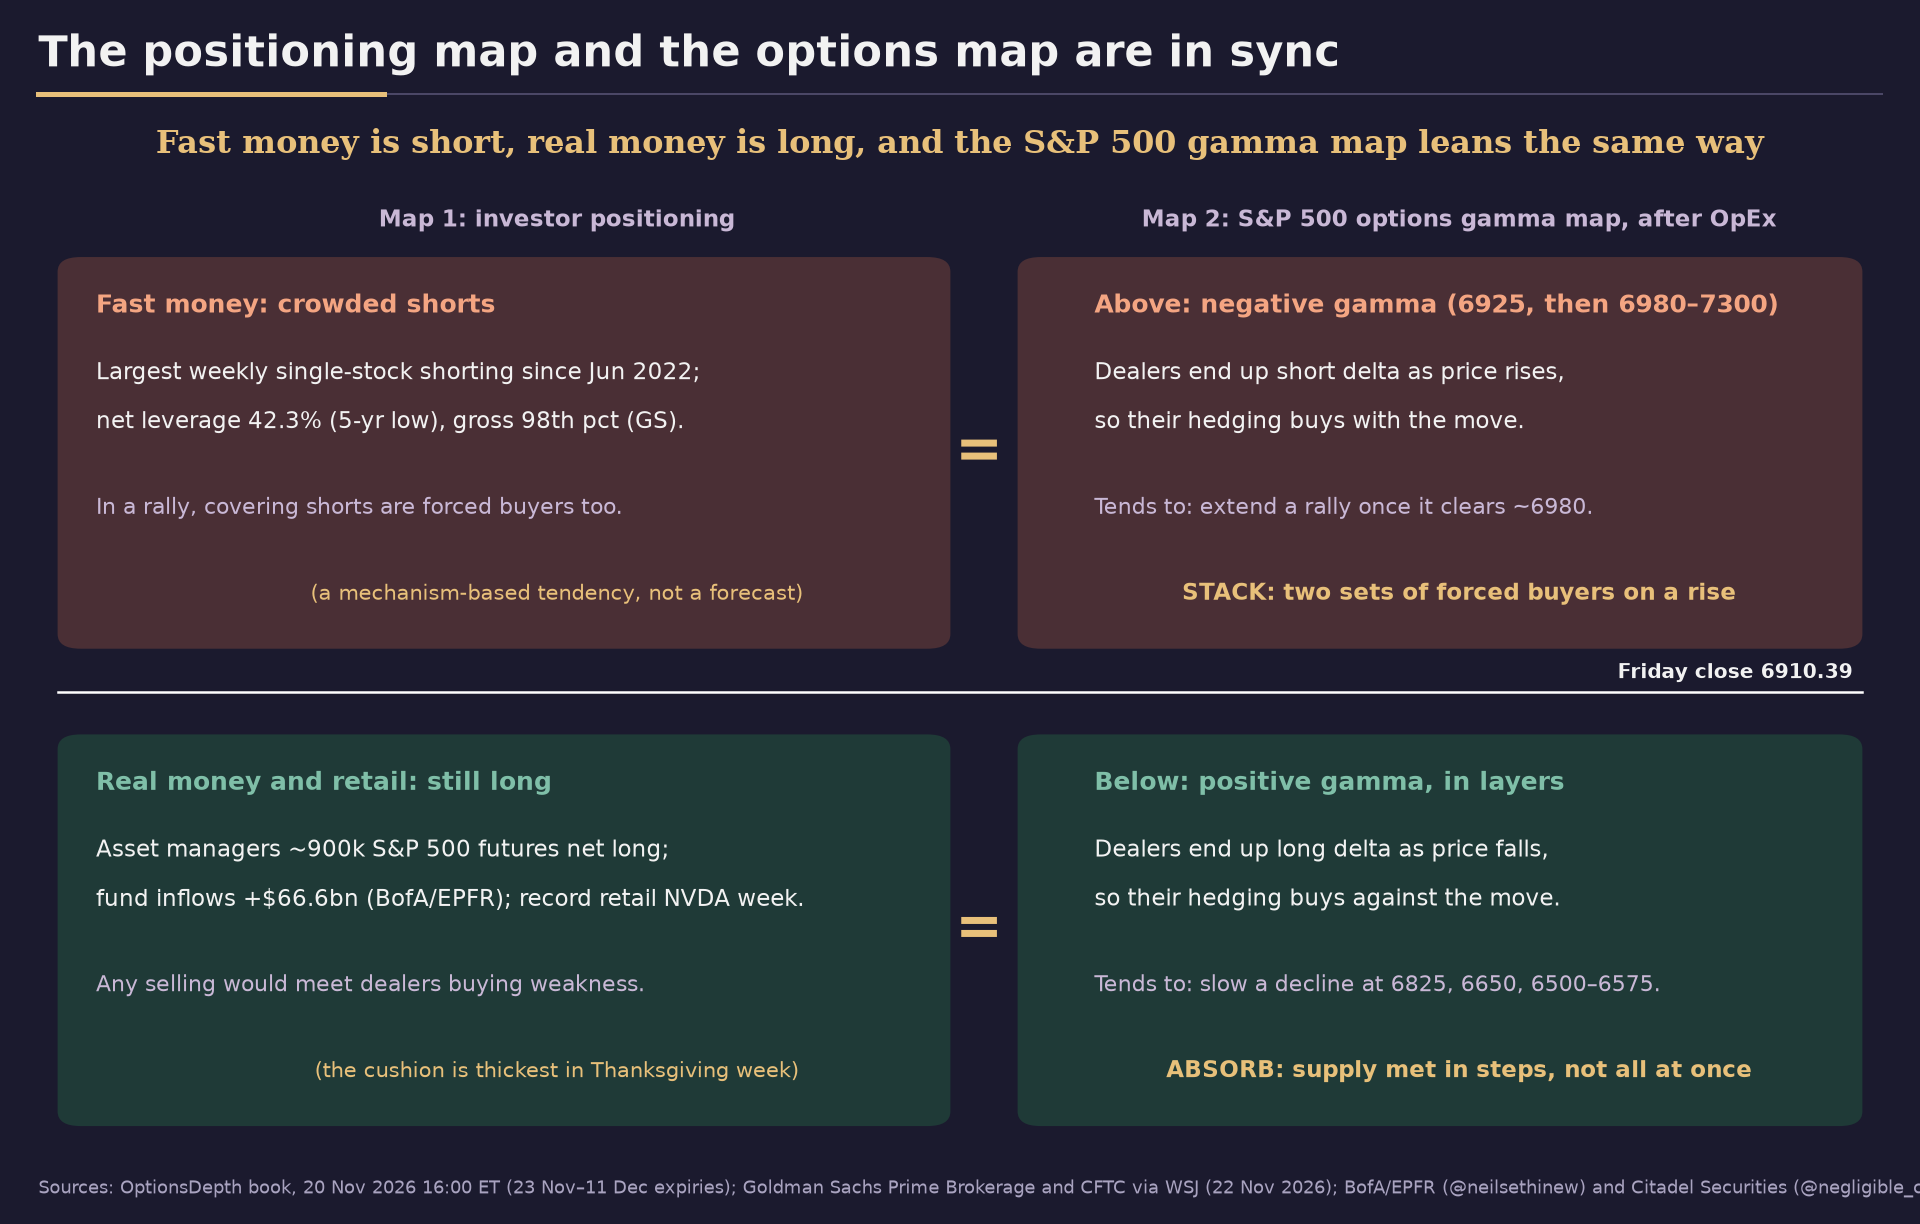
Two maps of the same market are now in sync. Map 1 is investor positioning: hedge funds, the fast money, are short, while real money and retail are still long. Map 2 is the S&P 500 options gamma map after Friday's Options Expiry (OpEx): negative gamma above the 6910.39 close, positive gamma in layers below. Yesterday's piece, Cushioned on the way down, free to run on the way up (film version, 7:43), covered Map 2. Today we lay Map 1 over it, test whether the link holds, and set out the two scenarios.
This is Part 1 of 2. Part 2 covers how every investor type has behaved in past sell-offs.
The weekend film: the new S&P 500 options map after Options Expiry (OpEx) (7:43).
Summary
- Two maps, one story. Map 1 shows who holds what. Map 2 shows how dealers' hedging behaves around the S&P 500 after Options Expiry (OpEx). Right now they move in sync.
- Map 1, positioning. Hedge funds have cut risk hard and added shorts. Long-only funds, pensions and retail have barely sold.
- Map 2, options gamma. Friday's expiry removed a large negative-gamma book. What's left leans one way: negative gamma above Friday's 6910 close, positive gamma in layers below.
- Why they move in sync. Above 6910, short covering and dealer hedging would both buy into a rise. Below, any real-money selling would meet dealers who buy weakness.
- Who is where. Hedge funds are short, with net leverage at a five-year low. Long-only funds still hold their futures. CTAs are short the Nasdaq 100. Retail is still buying the dip.
- Scenario one. If covering starts, a move through about 6980 can extend toward 7300.
- Scenario two. If real money sells, the layers at 6825, 6650 and 6500 to 6575 tend to slow it in steps.
- Timing. The cushion is thickest in Thanksgiving week. The 30 November expiry is the most negative in the window.
- The tells. Watch net drift: calls building means covering, while calls drying up and puts taking over means selling. It's a tendency, not a forecast.
Map 1 and Map 2
Map 1: investor positioning. The fast money has cut risk and gone short; the real money has barely moved.
- Hedge funds: Goldman Sachs Prime Brokerage says US single stocks were shorted every day from 13 to 19 November, the largest weekly shorting since June 2022 (Goldman note via Longbridge, 21 Nov). Net leverage is 42.3%, a five-year low, while gross is at the 98th percentile (WSJ via Chaincatcher, 22 Nov). The six-week tech-selling z-score is −4.4, a record (relayed by @AndreasSteno, citing Goldman). Goldman's desk calls positioning "washed out" (@neilsethinew, citing Goldman). Its panic index is at 9.8 out of 10, and Goldman says readings above 9.5 "have signaled near term relief" (@neilsethinew, citing Goldman).
- Real money: JPMorgan's US Tactical Positioning Monitor moved only −1 standard deviation in four weeks, short of the −1.5 that has marked a full clearing. Asset managers still hold about 900,000 S&P 500 futures contracts net long (WSJ, as above). Global equity funds took in $66.6bn last week (BofA/EPFR, relayed by @neilsethinew). BofA's Michael Hartnett wants "more positioning capitulation before giving all-clear."
Items marked "relayed" are client notes quoted on X; we have not seen the originals.
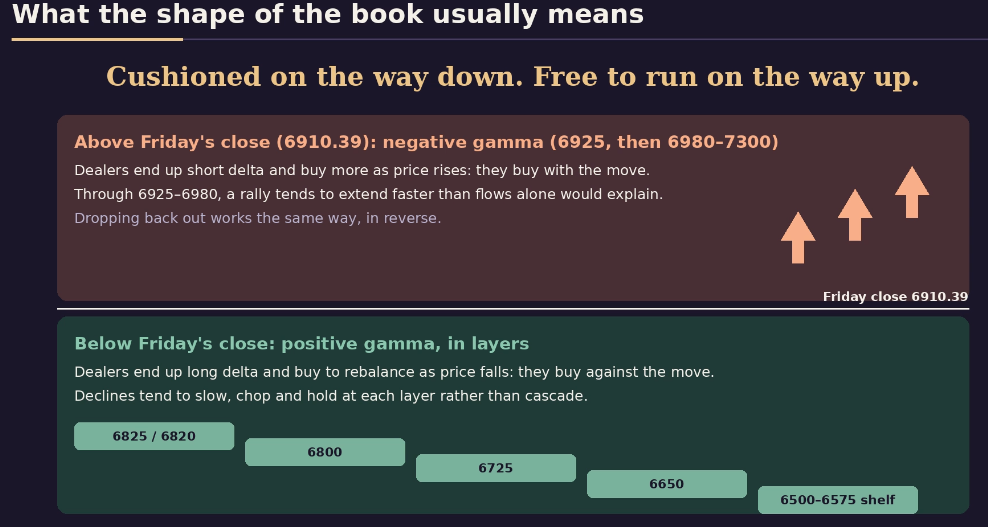
Map 2: the S&P 500 options gamma map after Options Expiry (OpEx). The expiring 20 November book was −18.79 M$ per point of gamma; that hedging is gone. The book that remains (23 November to 11 December) is close to neutral overall, but it leans one way. Negative gamma sits above Friday's 6910.39 close (6925, then 6980 to 7300). Positive gamma sits below it, in layers (6825, 6650, then the 6500 to 6575 shelf).
Are the two maps really in sync?
We tested the link rather than assumed it. Our verdict: partly justified, as a mechanism-based tendency. The mechanism is sound and well documented, and past episodes fit it. But nobody, including us, has a clean statistical test of positioning and gamma together.
Why positioning and the gamma map tend to reinforce each other (mechanism, not a measurement)
- Above Friday's close, two sets of forced buyers point the same way. In negative gamma, dealers' hedging buys more as price rises, and a hedge fund covering a short is also a forced buyer into a rising price, so the two stack. On 9 April 2025, Nomura's Charlie McElligott flagged dealers, levered ETFs and CTAs, all "recently flipped short," facing mechanical buying "the higher the market goes" (9 Apr 2025). The S&P 500 rose 9.52% that day.
- Below Friday's close, the remaining supply meets a cushion. The fast money has already de-grossed, so less forced selling is left. What remains sits with real money, and in positive gamma, dealers' hedging buys as price falls. Supply like that tends to be absorbed in steps rather than speed up the way it did on OpEx Friday.
- Where it falls short. The shorts are mostly in single stocks; the gamma map is the S&P 500 index book, so the link is indirect. Gamma shapes a move; it doesn't start one. Part 2 sets out the full evidence, including our own small test.
Two scenarios, with levels
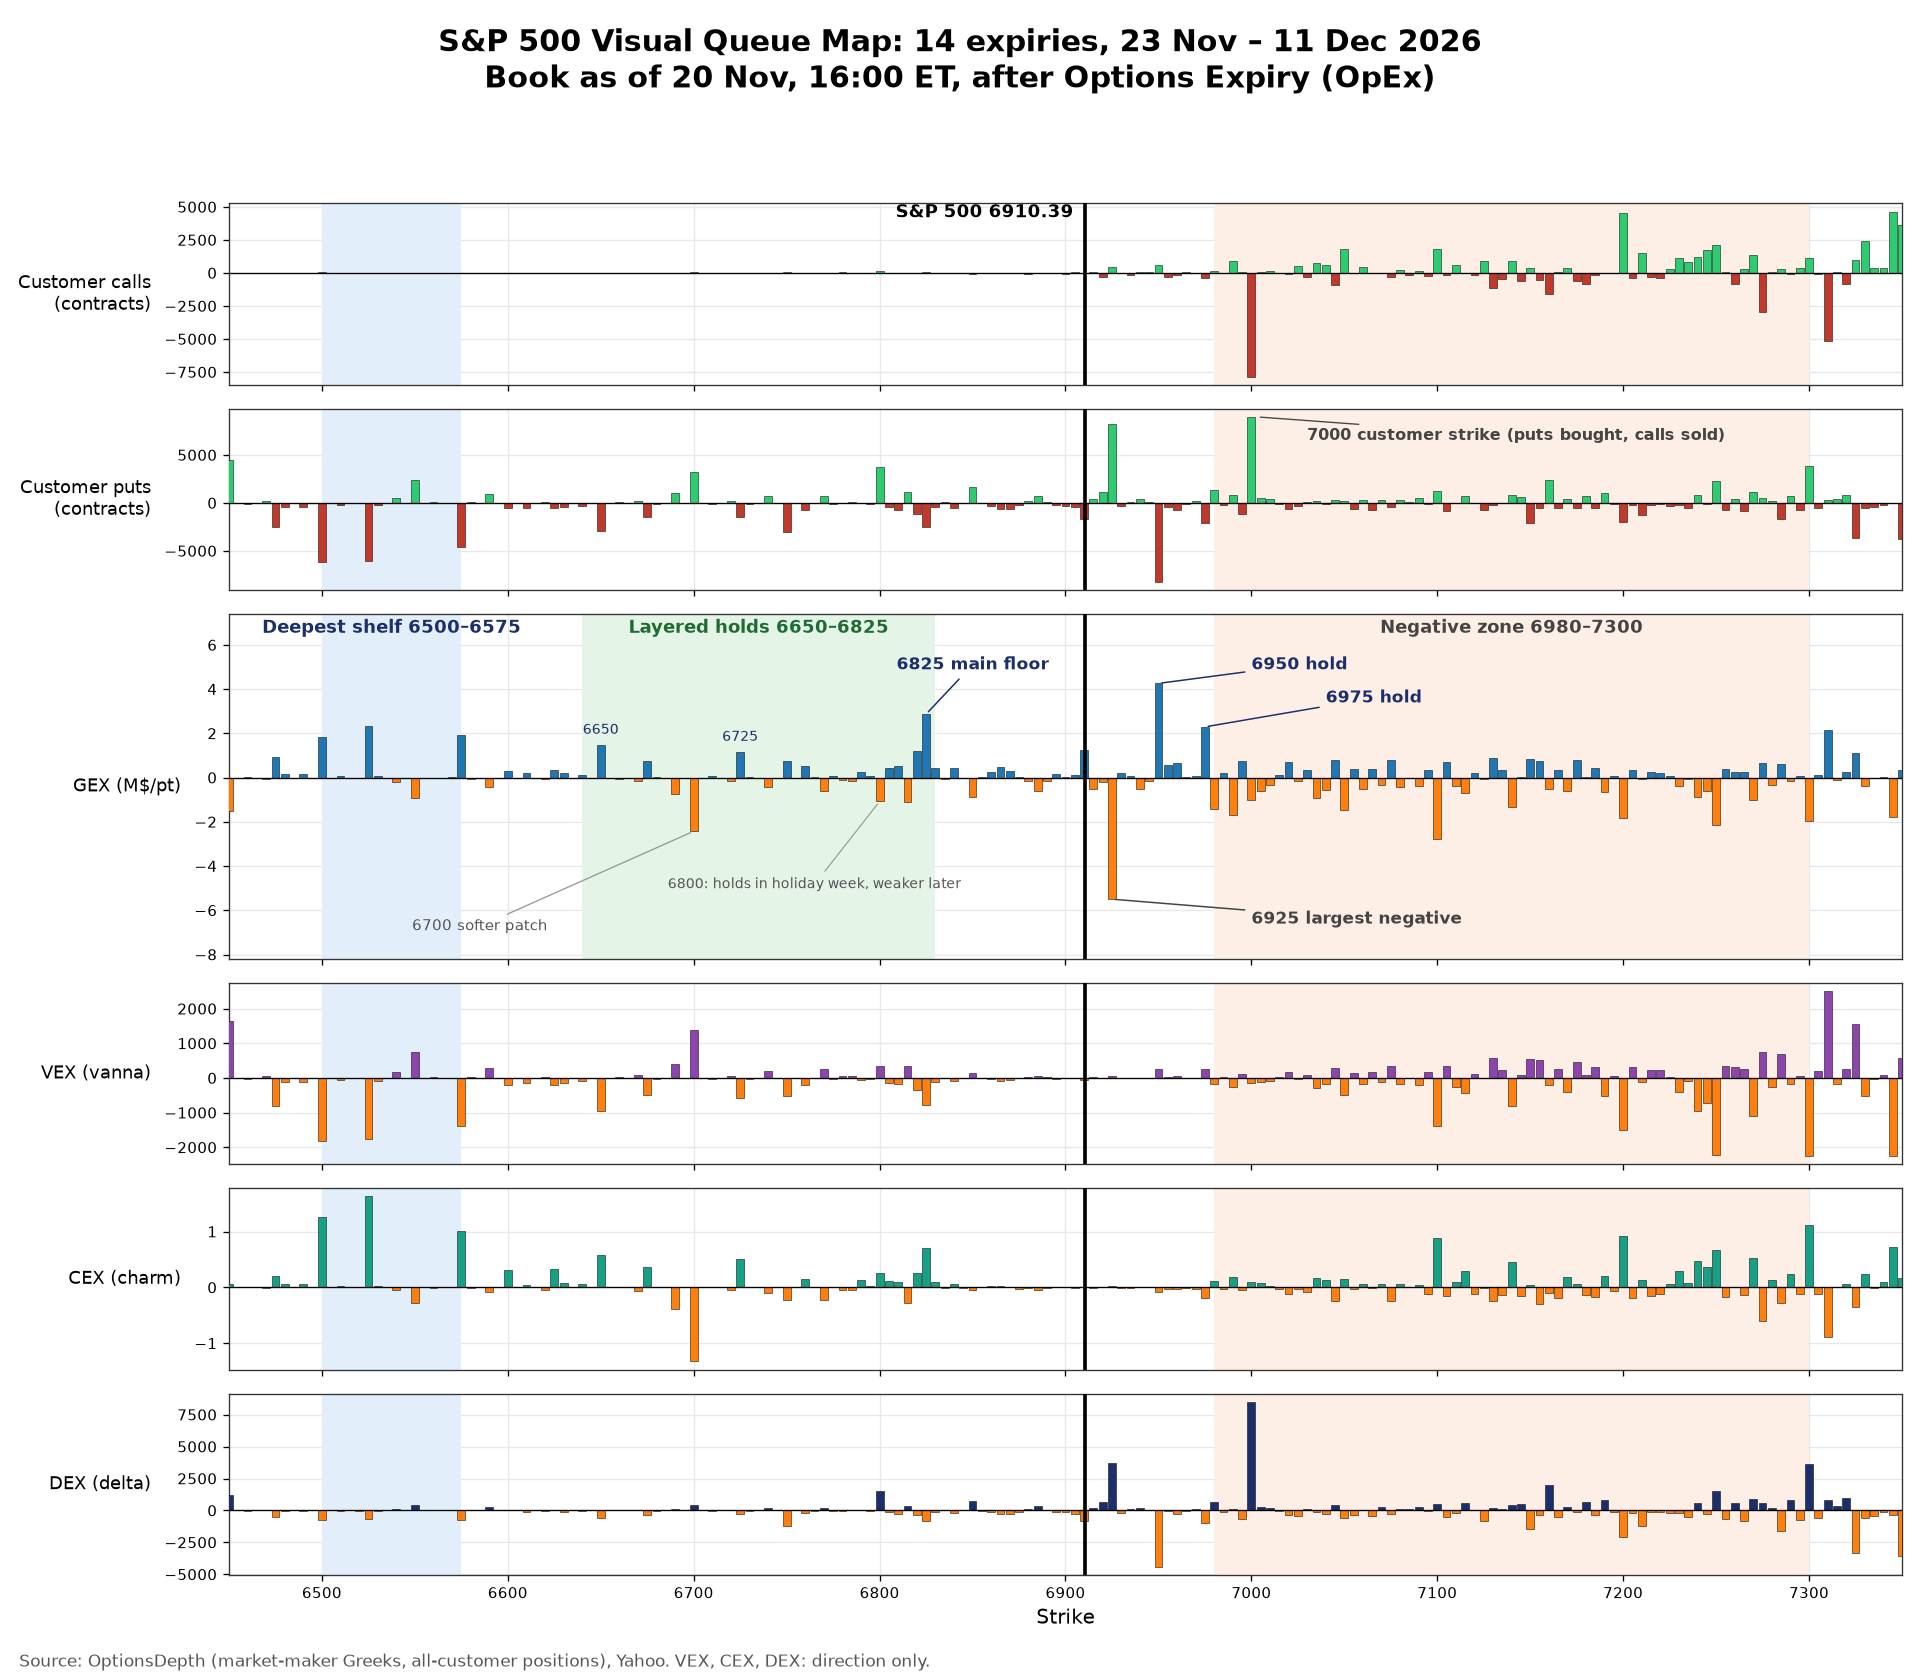
- Above: 6925 (−5.50 M$/pt) is the largest negative strike. 6950 and 6975 are holds that tend to slow a first bounce. From 6980 to 7300 the book is negative, and that is where covering and dealer hedging would stack.
- Below: 6825 (+2.87) is the main floor, with 6650 and the 6500 to 6575 shelf beneath it. 6700 (−2.43) is the one softer patch.
- Timing: the cushion is thickest in the Thanksgiving-week expiries. The 30 November expiry is the most negative in the window (−7.42).
If the fast money moves first (covering into negative gamma):
- Market-wide net drift turns up and holds, and SPX put buying fades. On Friday it closed near −$162M market-wide and −$99M in SPX.
- Customers buy calls from 6950 to 7300 and close or roll down puts at 6925 and 7000.
- The negative strip from 6980 to 7300 grows or moves higher on the next pulls, and the VIX eases as price rises.
- The most-shorted stocks and semiconductors lead, as in April 2025.
If the real money moves first (selling into the layers):
- Net drift rolls over, and fresh SPX puts are bought at or below 6825.
- Customer calls dry up and puts take over in SPY and QQQ: the retail tell.
- Positive gamma below price shrinks or migrates lower, and the 6700 soft patch deepens.
- Weekly data later show JPMorgan's monitor heading toward −1.5 standard deviations and fund flows turning to outflows.
Real money is not forced to sell, and short covering can reverse in a session: on 10 April 2025 the S&P 500 gave back 3.5% the day after its 9.5% gain. The bank figures are second-hand, and the book is a Friday 16:00 ET snapshot; Monday's pre-market pull will show how much it has changed.
What we watch
Our daily 0DTE notes track the tells live: net drift, customer put and call flows by strike, and where the negative and positive gamma moves on each pull.
This series is free to read at PAM Ghost. To get the next one in your inbox, sign up here: https://predictive-analytic-models-pam.ghost.io/#/portal/signup
Data: OptionsDepth snapshot 20 Nov 2026, 16:00 ET (market-maker Greeks, all-customer positions, 23 Nov to 11 Dec expiries). Index levels and historical moves: Yahoo Finance. Positioning and flow figures: Goldman Sachs, JPMorgan, BofA/EPFR and Citadel Securities, as credited; items marked "relayed" were quoted on X and not checked against the original notes.
Educational only.