
Options Expiry (OpEx): it's the 0DTE pipe, only bigger and slower
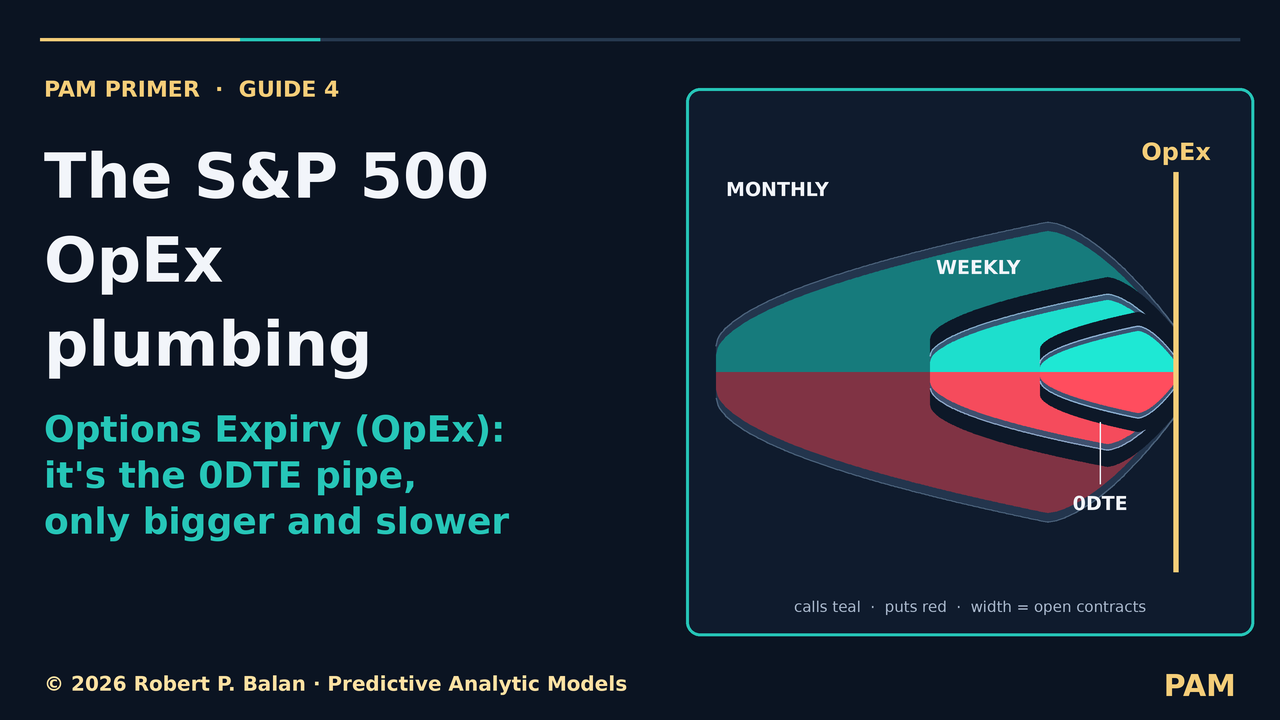
Options Expiry (OpEx) uses the same plumbing as the daily 0DTE book. The monthly pipe is only bigger, and slower.
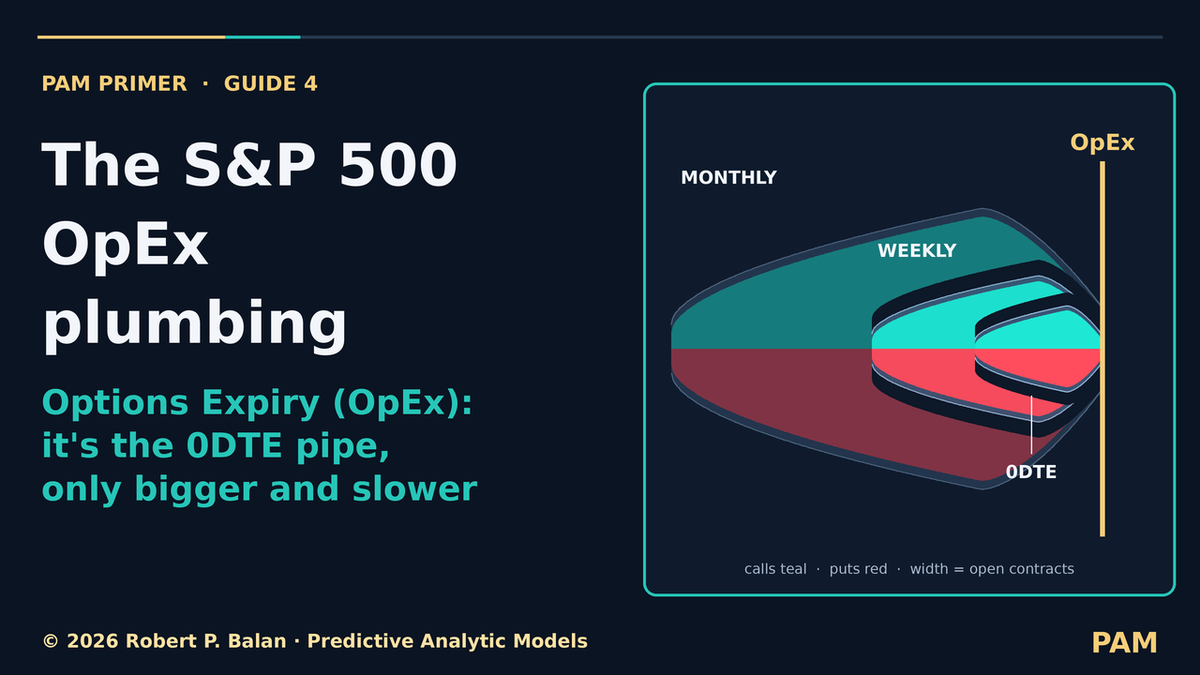
This is the full film, Guide 4 in the PAM primers. It sits with Guides 1 to 3 on the PAM primers playlist.
Every trading day, the S&P 500 has options that expire that same afternoon. We call that book the 0DTE pipe. On 16 November it held about 212,000 contracts at half past ten in the morning, and about 235,000 at a quarter past three. It did not shrink as the day went on. At the four o'clock close, all of it expired at once. One session, one pipe: it fills, stays full, and empties at the bell.
Once a month, on the third Friday, the biggest group of all expires together. That is the monthly Options Expiry (OpEx). This guide shows that it is the same pipe, only bigger and slower.
This is a preview. We are releasing it ahead of Friday's Options Expiry (OpEx) on 20 November 2026, so the data is fresh when you read it. Everything in the film runs to the 16 November close. The 20 November panels are marked "Filled after Friday's close (20 Nov)", and they will be completed once that session is in.
The same pipe, zoomed out
Pull back from one day to one week. Every Friday there is a weekly expiry too. Picture the same pipe stretched over five sessions: it builds, stays full, and empties at Friday's close. On that Friday, the weekly book is that day's 0DTE.
Pull back once more, and you see the monthly. The real November book first showed up in our data on 24 August, at about 170,000 contracts. Our data only reaches about ninety days ahead, so the book was already there before that. It reached about 541,000 on 30 October, and going into 16 November it still held about 536,000. Same shape as the daily pipe. Bigger, and at least ninety days long instead of one.
Put three months side by side and the pattern repeats. October was still about half a million contracts going into the day it expired, and the next session it was gone. November is full four sessions out. December, already the biggest, carries on beyond it.
Inside the pipe, and who sits on the other side
Look inside the November pipe and it isn't one tube. It is a set of levels, each with its own size, built up session by session as the S&P 500 moved through them. Some are holds, where the hedging leans against a move. Some are weak spots, where the hedging adds to it. On 13 November the S&P 500 dipped to 7500 and turned back up. On 16 November it broke through and closed below it, at 7,416.59.
On the other side of every option is a market maker. Market makers don't want to bet on direction, so they balance their risk by buying or selling the market itself as prices move. That balancing is what turns options positions into real buying and selling, and a large monthly book can lean against moves for weeks.
Expiry Friday: two kinds of options, one date
Two kinds of options share the third Friday. The standard monthly options stop trading on Thursday and settle on Friday's opening prices, so they never trade on the Friday itself. The weekly options with the same date trade all day and expire at the close. Those are Friday's 0DTE. Our data counts both together as one November book, and it can't split them.
When November settles on Friday, its pipe will be gone. December's pipe is already large and will carry on. That is what happened in October: about 502,000 contracts left with the October book, and the next session November and December together were about 42,000 smaller, not larger. The size didn't move into the next pipe. It simply left. Then the map is redrawn from what is left, and the levels are recalculated from the new positions.
What we tested
We tested two of these ideas on the data we have, from August to November. A daily level sitting on top of a big monthly one didn't hold any better: about half the time the day closed beyond it either way. And once fear, measured by the VIX, was taken into account, the S&P 500 didn't move more after big expiries.
We also checked whether the size of the books, or the mix of calls and puts inside them, moved the S&P 500. Across sixty sessions we found no relationship we could measure. Three months and two expiries is a small sample, so we hold this lightly. But the pipes describe the stage. They don't tell us which way the next move goes.
Put it all together: every month a pipe shows up in our data, fills, stays full into its Friday, and is gone. So how do we deal with Options Expiry (OpEx)? The same way we read the 0DTE pipe. It's only bigger, and slower.
This guide builds on Guide 3, The 0DTE plumbing: two regimes, one system, which shows how a wide pipe absorbs moves and a steep one speeds them up. PAM uses the same read every session: each morning the 20-Day Game Plan maps the live options book out to the next monthly expiry, and each evening the 0DTE EOD Recap reads how the session actually ran. How to Read the S&P 500 0DTE EOD Recap and How to Read the S&P 500 20-Day Game Plan walk those two daily series plate by plate.
"Trade the options 0DTE plumbing, not the price vector level." — Robert P. Balan (PAM)
Get the Game Plan and the 0DTE EOD Recap by email, free: Subscribe at Predictive Analytic Models
© 2026 Robert P. Balan · Predictive Analytic Models
Educational only.